
This is part of our Essential Guide To Qualitative Analysis | Code Your Surveys Faster | Take Our Free Online Qualitative Data Analysis Course | Try Delve AI | Start a Free Trial of Delve
Your survey results are in. The closed-ended questions gave you concrete metrics, but now you’re facing hundreds of open-ended responses ranging from single words to full paragraphs. What you need is a structured approach to help you pick out key patterns from all this qualitative data.
That’s what qualitative analysis helps you do through a process called coding. This article walks through modern methods for survey analysis and looks at tools like Delve’s survey analysis software that make the qualitative coding process much easier to manage.
Finding your “why”: What is qualitative survey analysis?
When you analyze open-ended survey responses, you’re looking for patterns and insights that numbers can’t capture. Unlike quantitative analysis that deals with statistics, you focus on understanding the meaning behind words and finding common threads across responses. You’re looking for the “why.”

You’ll use qualitative survey analysis when you have open-ended questions like:
- “What challenges did you face during online learning?”
- “Describe your experience with campus mental health resources.”
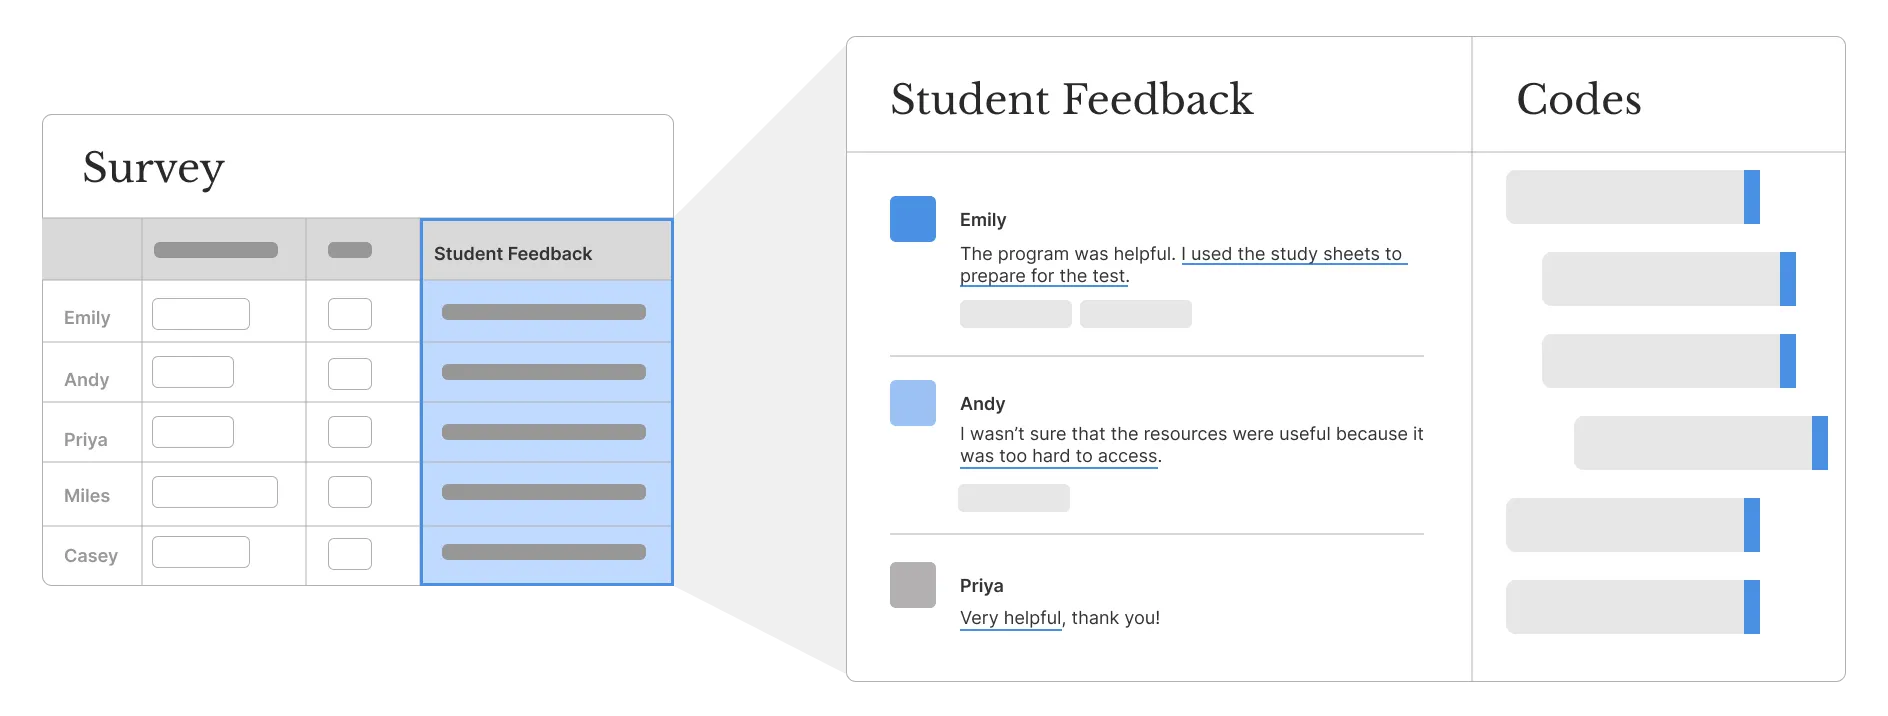
The process involves systematically reviewing responses, identifying recurring concepts, and organizing these into meaningful groupings called codes. If you were studying how researchers use survey analysis software to collaborate on projects, you might develop codes like “Collaboration Styles,” “Co-coding,” and “Splitting Transcripts” based on what emerges from the data
The problem with most qualitative survey analysis tools
Most people start with Excel because it’s familiar. You create columns for each code, copy and paste relevant quotes into cells, maybe add color-coding for different sentiment levels. This approach includes basic coding – your column headers serve as codes and responses get sorted into categories.
Why Excel breaks down
But coding is also where things get tricky. Excel forces you to pick one category per response, meaning responses that clearly belong nested in multiple categories force you to choose just one, or create duplicate rows that break your data structure. You’re stuck scrolling through hundreds of cells or hitting CTRL + F to find quotes you remember while wrestling with version control issues in collaborative work.
The clunkiness eventually reveals another, deeper problem with spreadsheet analysis. When participants give rich answers to open-ended questions, spreadsheets corner you into coding the complete response. The problem is those detailed answers usually contain multiple distinct ideas that need separate codes.
Think about this response: “I loved the flexibility of online classes and being able to work at my own pace, but the lack of interaction with professors made it really hard when I was struggling with concepts, and the technology issues during exams were extremely stressful.”
This response contains multiple concepts and potential codes: positive aspects (flexibility), academic support challenges (professor interaction), and technical difficulties (exam issues). Most tools force you to pick just one code for the entire response, losing all that meaningful nuance and context.
How to analyze surveys in Delve
What you need is software built specifically for coding survey responses, not spreadsheets. Survey analysis tools like Delve give you more control over your data and the granularity of your code. Instead of forcing you to code entire responses as single units, this coding tool lets you dive into each participant’s answer and pull apart the nuances by coding specific phrases within the same response.
Set up your qualitative survey analysis in seconds
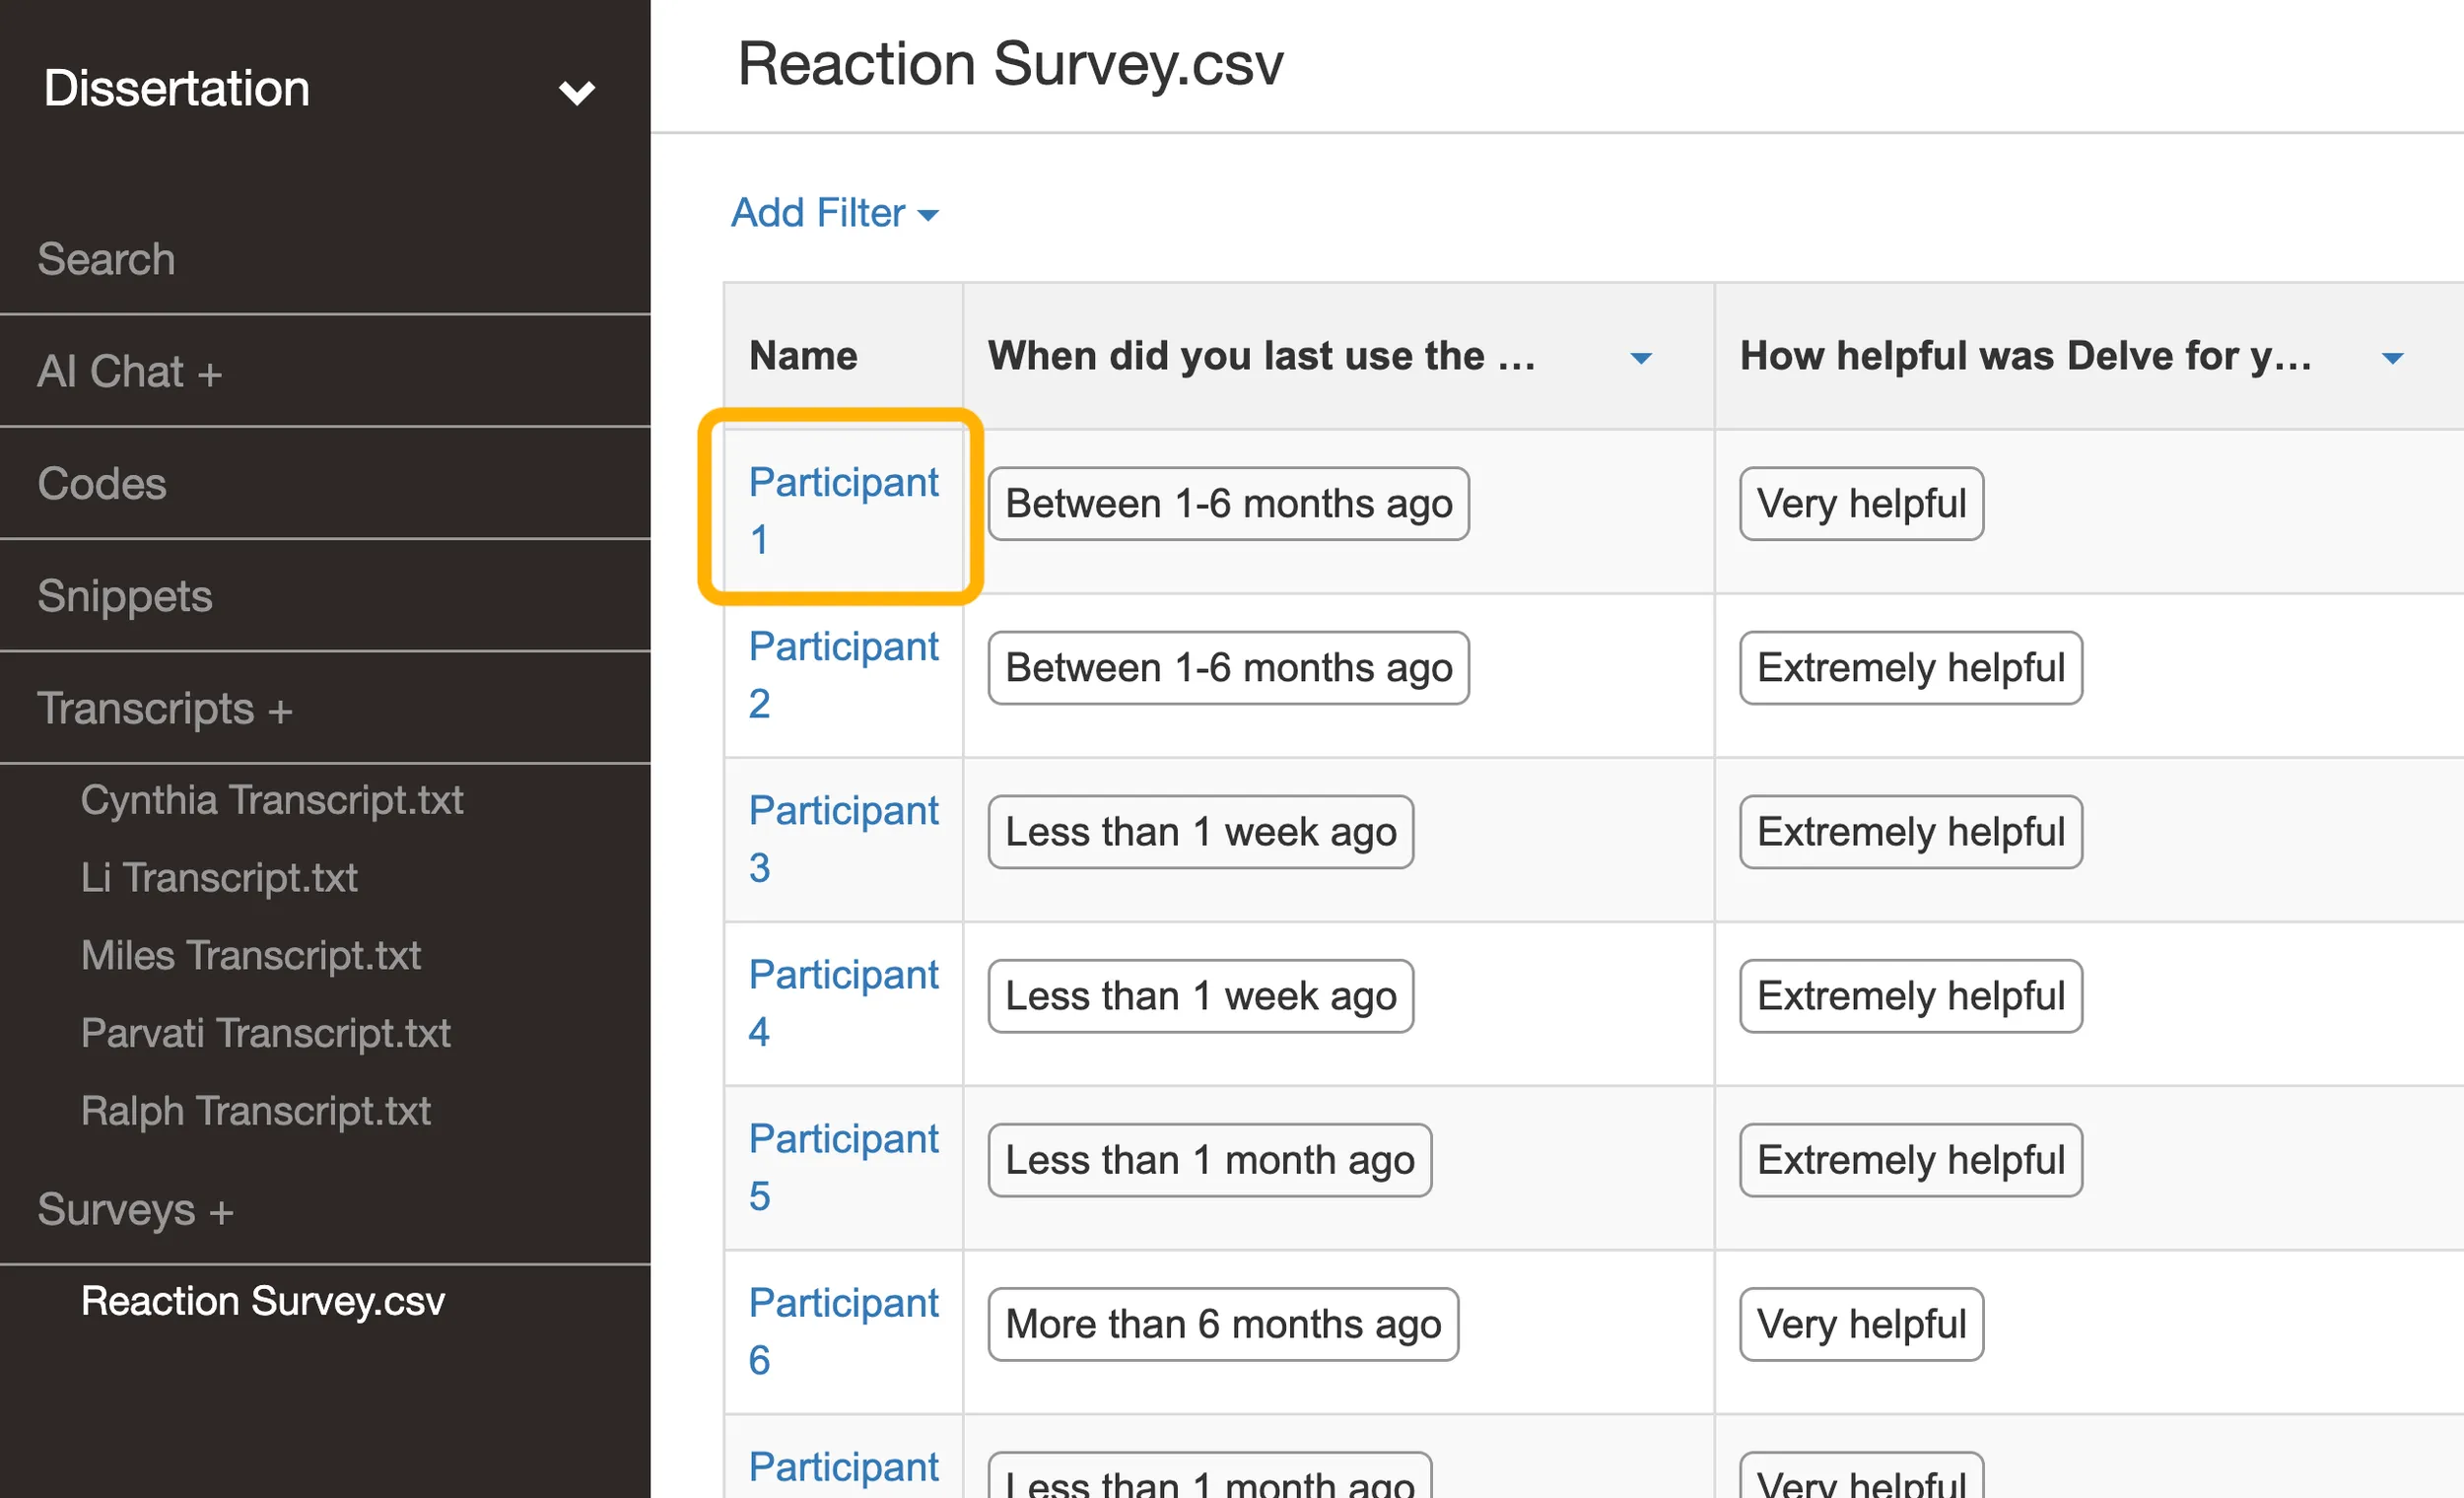
Upload your survey data by dragging your CSV file into the Surveys section. Delve automatically formats everything, with each row representing a participant’s responses and each column corresponding to a survey question.
After uploading, you’ll see your survey data displayed in a table format. From here, you can:
- View individual responses: Click on a participant’s name to see all their responses across questions
- Explore question responses: Click on any answer to open the Question Page showing all participant responses to that specific question
As you’ll see, this dual view approach streamlines your coding, considering you’ll want to switch perspectives to spot patterns within individual responses and across all your participants.
Coding survey responses with precision
Here’s where Delve’s survey analysis really stands out. You can highlight specific phrases within survey responses and give each phrase different codes, even overlapping codes within the same response.
Take a response about research collaboration: “We usually split the transcripts between team members to code individually, but when we get to complex sections we’ll do co-coding sessions where we work through difficult passages together, though sometimes the different coding styles between researchers can create inconsistencies.”
Here’s how you could extract multiple codes from within the same snippets:
“We usually split the transcripts between team members 1,2 to code individually, but when we get to complex sections we’ll do co-coding sessions where we work through difficult passages together 3,4 , though sometimes the different coding styles between researchers can create inconsistencies 5,6 .”
Codes:
- Splitting transcripts
- Team coordination
- Co-coding
- Collaborative problem-solving
- Collaboration styles
- Quality control challenges
Switching between participant and question views
After you upload, you have 2 options for viewing your data. You can look at participants’ responses, or look at all responses to a single question. Toggling between participant and question views helps you spot connections across your data. For instance, when you look at one participant’s complete responses, you might notice they mention “Co-coding” in one question and “Team Coordination” in another, showing how these collaboration methods connect in their workflow.
Viewing all survey responses.
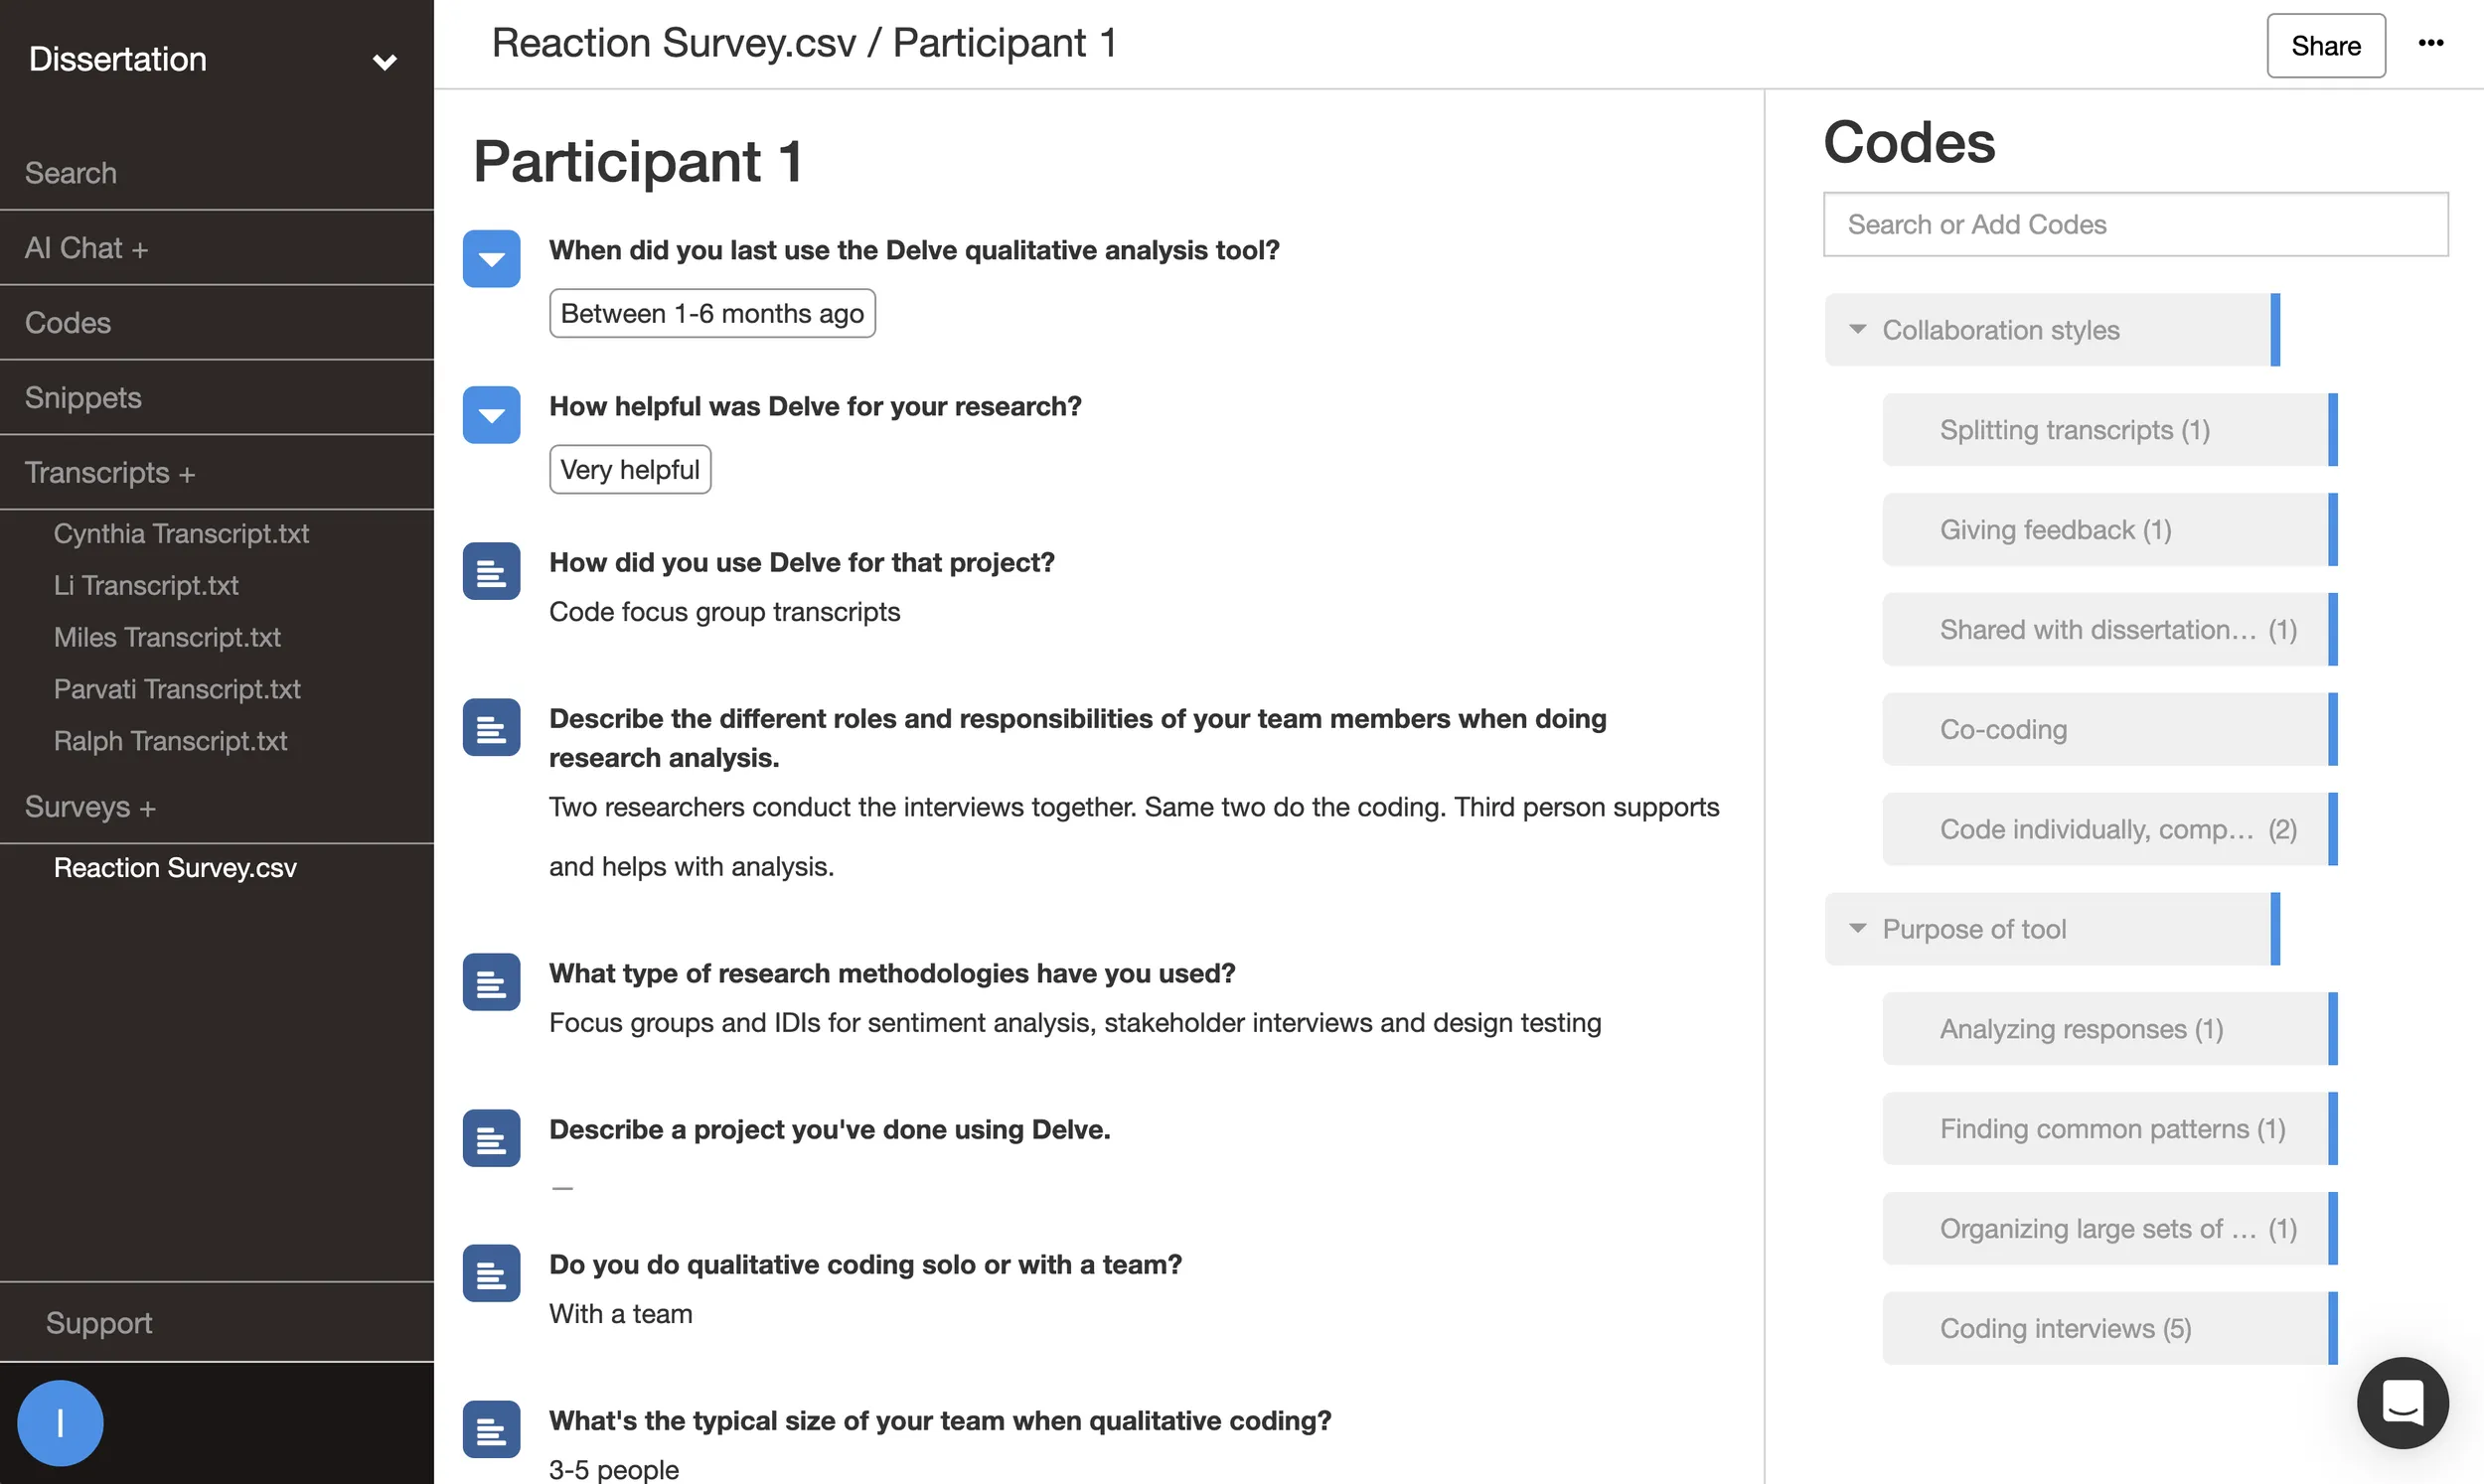
Viewing all single participant responses.
Filtering responses by demographics and answers
Filtering survey responses lets you dig down into specific subsets of your data by demographics or answer patterns. This is particularly useful when you want to understand whether certain groups share common experiences or have different perspectives on the same topics.
Setting up demographic filters: For demographic questions like asking about “Academic Field” or “Experience Level,” you’ll need to convert them to single choice question types before filtering. Click the dropdown arrow next to the question name at the top of the column, select “Convert to single choice.” This makes them work as filters but means you can’t code those specific responses.
Delve gives you two ways to filter your survey data:
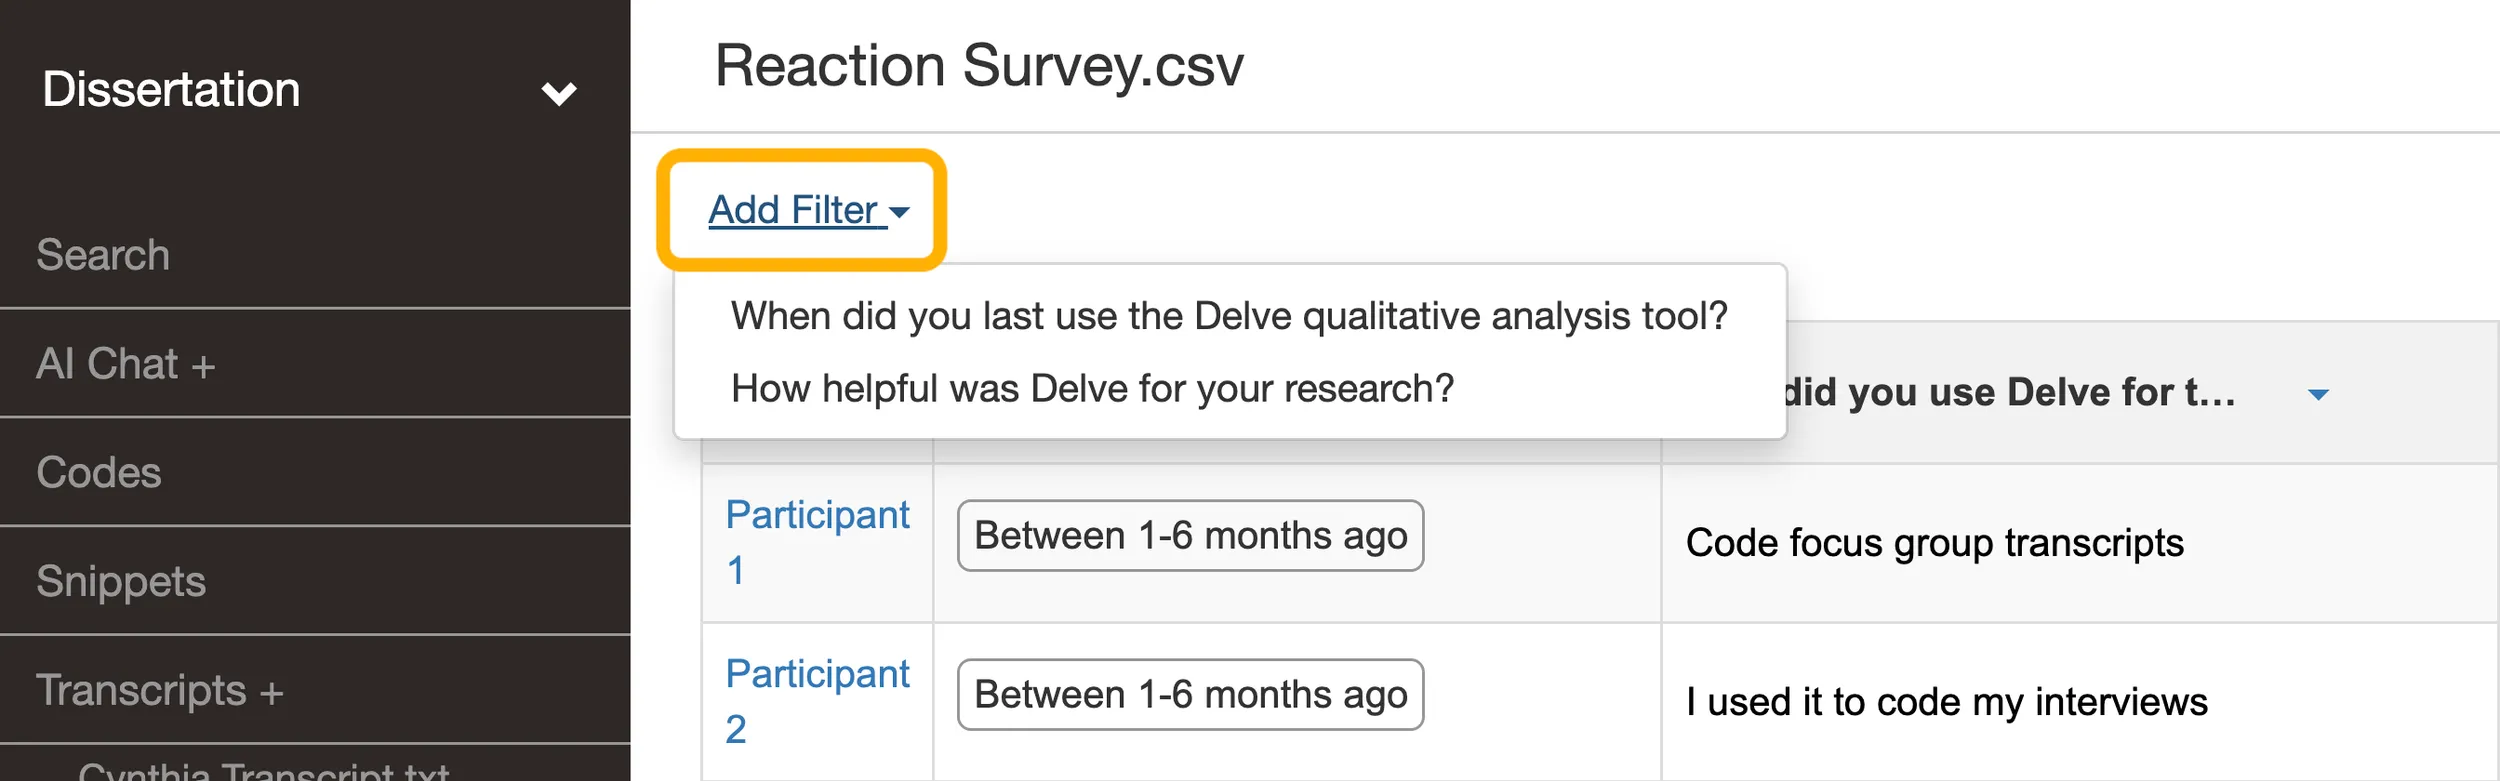
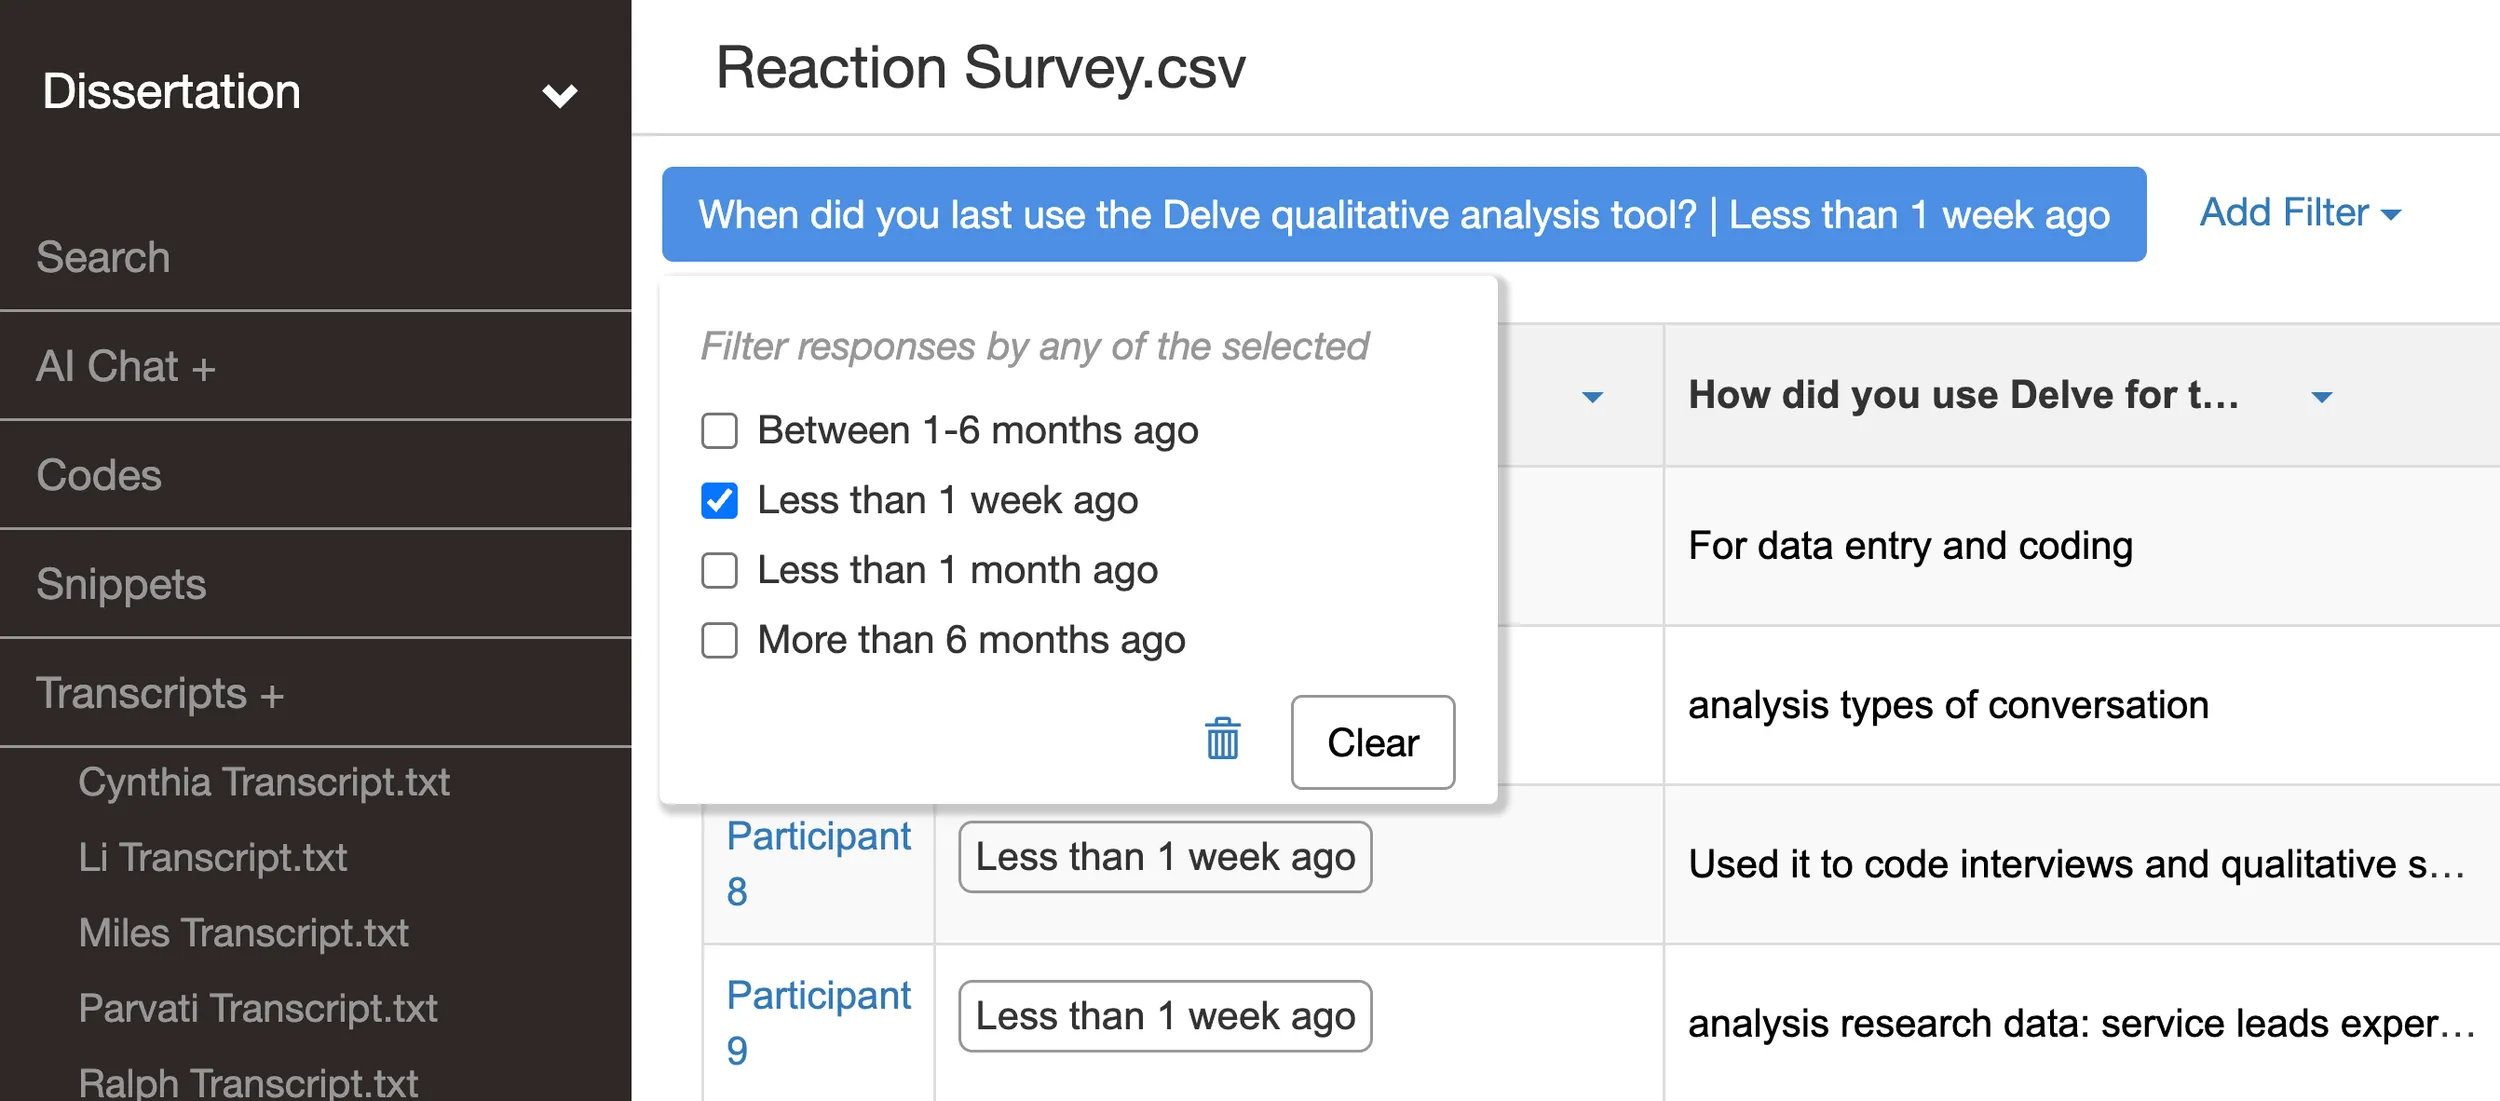
1. Filter menu approach: Click the “Add Filter” button at the top of your survey view, then select which question you want to filter by (such as “Academic Field” or those in the image above). From the filter menu that appears, choose one or more options like “Psychology” and “Sociology” to compare responses between these groups.
2. Quick filtering: When you spot an interesting response in your table, locate that participant’s demographic information, then click directly on the demographic value (like “Graduate Student” in their “Academic Field” response). The view automatically updates to show only participants with that same demographic characteristic.
These two approaches work together to support different analysis needs. Use the filter menu when you have planned comparisons in mind, like systematically examining how different academic fields approach collaboration. Use quick filtering when you’re exploring and notice something intriguing that warrants deeper investigation.
Excel vs Delve: comparing qualitative survey analysis tools
| Excel | Delve ✓ |
|---|---|
| ❌ One code per cell | ✅ Unlimited overlapping codes |
| ❌ Context easily lost | ✅ Context maintained |
| ❌ Manual quote searching | ✅ Instant quote retrieval |
| ❌ Version conflicts | ✅ Real-time collaboration |
| ❌ Performance degrades | ✅ Handles large datasets |
| ❌ No AI coding assistant | ✅ Built-in AI coding assistant |
Making survey analysis work for your research
High quality qualitative survey analysis starts with clear research questions but remains open to unexpected patterns. You usually begin by reading through a sample of responses to identify initial codes, then systematically code your full dataset while refining your approach.

But remember that survey responses often contain multiple insights within single answers. The best survey analysis tools let you capture multiple codes without losing the link between them. Look for patterns like:
- Do students who mention academic stress also reference time management challenges?
- Do satisfaction ratings correlate with specific service features?
Bonus tip: Get AI assistance for coding decisions
While AI can’t automatically code complete surveys, you can get support for specific challenges. Delve’s AI Chat works with individual survey snippets to help you talk and think through coding decisions.
Say you’re looking at a response about “struggling to balance coursework with family responsibilities” and you’re unsure whether it fits under “Academic Stress” or “Work-Life Balance.” Ask the AI Chat to review that snippet and discuss options. It might help you see the response contains elements of both themes, or suggest creating a more specific subcode.
This targeted AI assistance offers several features that work well when you often run into similar coding dilemmas across multiple responses. Once you work through the logic for one complex response, you can apply that reasoning to similar cases throughout your dataset.
Ready to transform your survey analysis?
Move from scattered spreadsheets and complex treasure hunts into a focused, evidence-backed process. Try Delve’s qualitative survey analysis tool free for 14 days and experience the difference purpose-built qualitative analysis makes for your research.
Want to explore more qualitative analysis approaches?
Research Methods:
- How to Do Thematic Analysis – Step-by-step guide for analyzing interview patterns
- Essential Guide to Coding Qualitative Data – Master the fundamentals of qualitative coding
- How to Do Grounded Theory – Step-by-step guide for grounded theory research
- Complete Guide to Collaborative Qualitative Research – Learn how to work with a team
Software Comparisons:
- Which QDA Software is Easiest to Learn? – Compare learning curves across platforms
- Which QDA Tool Makes Team Coding Easiest? – Find the best tools for research collaboration
FAQs about qualitative survey analysis
How do I get started if I’m new to qualitative data analysis? Start with the free qualitative coding course to learn the fundamentals, then try Delve’s 14-day free trial. Most people can begin coding their first project within a few hours of signing up.
Can multiple researchers work on the same project? Yes, you can add collaborators to any project. Team members can code independently, compare their approaches, and discuss coding decisions directly in the platform. Check out the collaboration guide for workflow tips.
What’s the difference between analyzing interviews and surveys? Interviews give you longer narratives to code, while surveys typically have shorter, more targeted responses. Delve handles both, but with surveys you can code specific phrases within responses rather than coding entire answers as single units.
Can I filter responses by demographics or specific answers? Absolutely. You can filter your survey data by any demographic question or response pattern to analyze specific subgroups.
What if I need to hide certain questions from my analysis? Delve lets you show or hide questions as needed, so you can focus on relevant data without deleting anything permanently.
What’s the difference between analyzing open-ended survey responses and analyzing interview transcripts? Survey responses are shorter and more focused. Interview transcripts give you context, follow-up, and natural conversation flow. With surveys, responses are often a sentence or two, so your coding needs to work at a finer level of granularity. You’re also working across many more responses than in a typical interview study. Patterns tend to surface quickly, but capturing nuance when responses are brief takes more deliberate attention during coding.
How many open-ended responses do I need before qualitative analysis makes sense? Even small survey datasets benefit from systematic coding over loosely reading through responses and summarizing impressions. With fewer than 30 responses you can probably work manually without much trouble. Above that, dedicated coding software becomes valuable for tracking codes, filtering by theme, and making sure patterns buried in later responses don’t get missed. Delve’s survey analysis feature lets you code specific phrases within responses rather than forcing you to code entire answers as single units.
Why doesn’t Excel work well for coding open-ended survey data? Excel forces you to code entire responses as single units, which means a response that touches three different themes gets jammed into one category and you lose the nuance. It also makes it hard to see all the excerpts tagged to a given theme without elaborate filtering. Qualitative coding software lets you highlight specific phrases within a response and assign multiple codes to the same answer, which is closer to how open-ended data actually works.
How do I report qualitative survey findings in a research paper? Structure your findings around the themes or codes that emerged from your analysis. For each theme, describe what it captures, how frequently it appeared, and quote representative responses to illustrate it. Avoid just listing percentages. Show the meaning behind what respondents said. Including your codebook or a summary of it in the appendix lets readers evaluate your analytical decisions independently.