
This is part of our Essential Guide to Coding Qualitative Data | Start a Free Trial of Delve | Take Our Free Online Qualitative Data Analysis Course
Axial coding is your next step after initial coding. It’s where you start seeing how all your separate codes connect to tell a bigger story.
Staring down hundreds of pages of interviews and research notes is overwhelming. Most researchers start by breaking everything into bite-sized pieces with labels and codes. But then what? You’ve got dozens (maybe hundreds) of disconnected codes in your codebook and no roadmap to follow.
Which patterns matter? What’s the real story in my data? Without a clear approach, it’s easy to miss consequential connections or rush to conclusions your research can’t fully support.
That’s where axial coding comes in, which is part of a broader coding process:
-
Start with initial (open) coding – breaking down your data into labeled pieces
-
Then comes axial coding – connecting those pieces to find deeper relationships
-
Finally, selective coding – weaving everything into a coherent narrative

This article focuses on the secondary axial coding step, where you organize all these scattered ideas. As we go, you’ll learn how axial coding works through axial coding examples, discover practical techniques for handling unwieldy code sets, and see how coding tools like Delve make the process easier to manage.
What is axial coding in qualitative research?
Think of your initial codes as a first draft. In axial coding, you’ll build something more sophisticated by examining how different parts of your research connect and influence each other. This naturally inductive approach comes from Strauss and Corbin’s (1990) work in grounded theory, where you develop understanding directly from your data rather than starting with existing theories and codes.
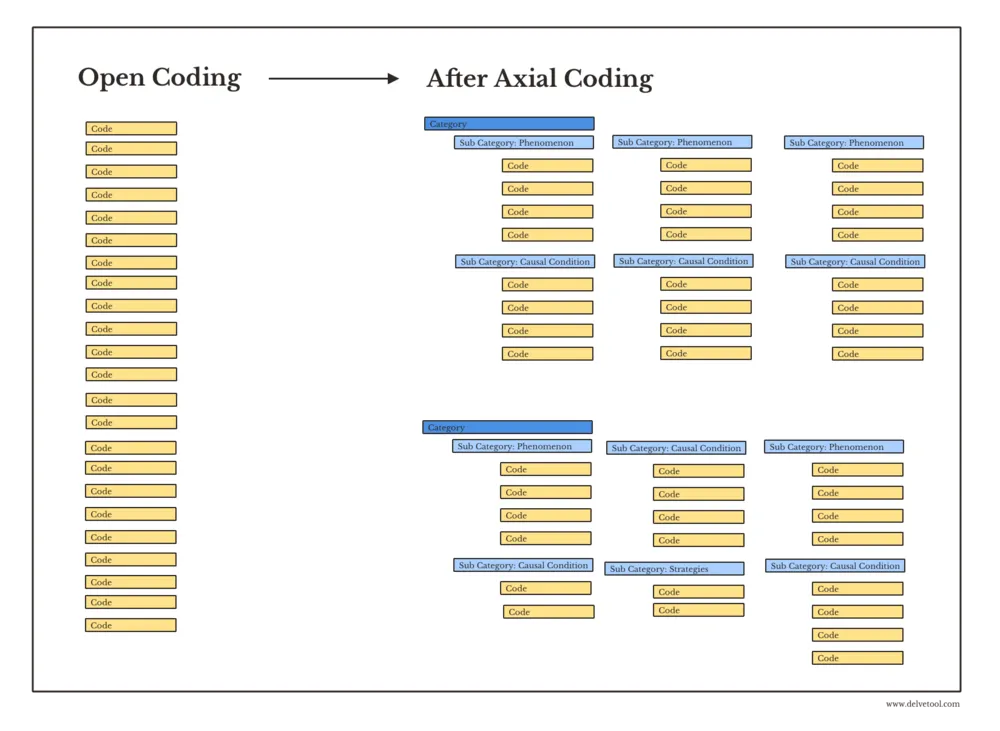
After your first round of coding, you’ll have a sprawling list of codes. Some will probably be narrow and specific, others broad and conceptual. This first step is about being open and flexible with your data, breaking down your data into manageable pieces and labeling what you see. Axial coding helps you organize these into meaningful categories by examining:
-
What triggers certain behaviors or situations
-
How people respond to these situations
-
What outcomes result from their responses
-
How context shapes these patterns
Once you’ve connected your initial codes through axial coding, you’ll have powerful themes structured around central axes. These reveal the underlying relationships in your data, transforming scattered observations into a coherent narrative that makes your qualitative findings both meaningful and actionable.
While axial coding originated in grounded theory research, you can use it with any method where you build understanding inductively from the ground up. Whether you’re doing thematic analysis or another qualitative approach, these coding techniques help you develop patterns from the ground up. As you go, you’re building meaning by closely engaging with your data. (related: Inductive vs. Deductive Thematic Analysis)
From chaos to clarity: Building on your initial codes
Without axial coding, it would be easy to get lost in the sheer amount of ideas you generated during that first coding pass. That first coding round is fast and loose in order to build your codebook. Many codes may seem unrelated, and you risk overlooking important connections or leaping too soon into themes without fully unpacking your data.
Axial coding provides the structure you need to piece everything together, ensuring that you:
-
Clarify relationships among codes rather than keeping them isolated
-
Build a “big picture” understanding of your data’s central storyline
-
Avoid superficial conclusions by systematically checking for causes, contexts, and consequences
Traditionally, you’d tackle all this using sticky notes, spreadsheets, or word processors. However, modern coding tools like Delve provide web-based software that makes it easy to stay on top of things. You can sort, merge, or rename your data with automatic updates across your project. When you’re coding with a team, there’s no juggling spreadsheets or manually merging work files. Just a clear, up-to-date view of your newfound categories.
Let’s see how axial coding works with a real example…
Digging into an axial coding example
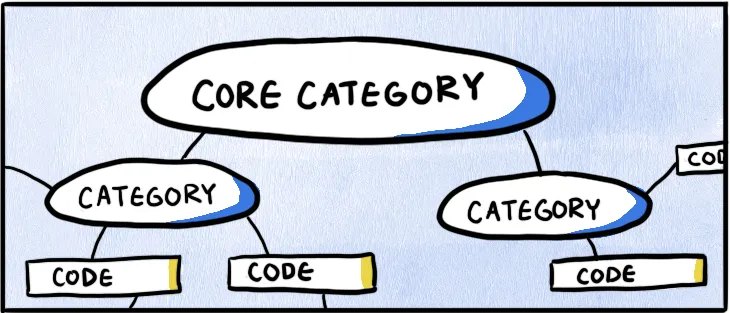
We’ll use a hypothetical study on how New Yorkers adapted during COVID-19 lockdown for this example. Following Corbin and Strauss’s (1998) coding paradigm, we categorized initial codes under phenomenon, causal conditions, strategies, consequences, context, and intervening conditions. These categories are the “axes” around which their supporting codes revolve.
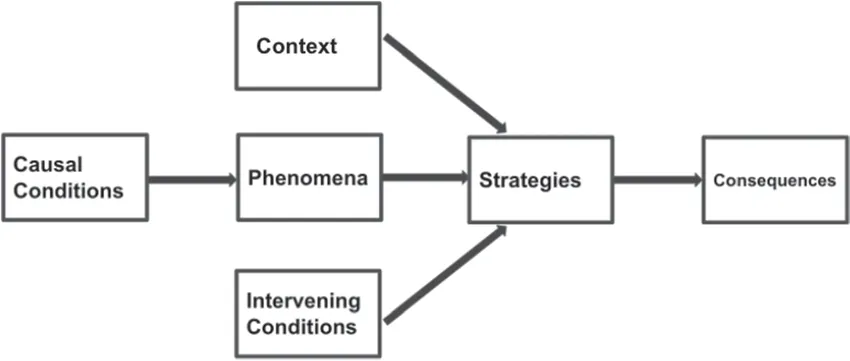
Image: Graphic of Corbin & Strauss’s Coding Paradigm (Corbin & Strauss, 1998)
Each of these subcategories highlights a key piece of the story behind the data: what’s happening, why it happens, how people respond, and which broader factors shape those responses.
Quick explainer: Corbin & Strauss’s Coding Paradigm
When you’re doing axial coding, you’re looking for specific types of connections in and across your data. Corbin & Strauss created a helpful framework that breaks these connections into six key parts:
-
Phenomenon is your central focus - the key event, issue, or situation you’re studying
-
Causal conditions explain why something happens - the triggers or reasons behind your phenomenon
-
Context shows the specific setting or circumstances where this happens
-
Intervening conditions are the broader factors that influence what’s happening, like someone’s background or available resources
-
Strategies reveal how people handle or respond to the situation
-
Consequences show what results from their actions - both intended and unexpected
Axial codes are a way to understand a story: you have what caused something to happen, the main event itself, where and how it happened, how people dealt with it, and what resulted from their actions. As you go, you’ll likely find yourself wrangling overlapping codes and trying to make sense of connections without losing key details. This is where a structured approach and purpose-built filtering tools save you a lot of time.
After the first round of initial coding
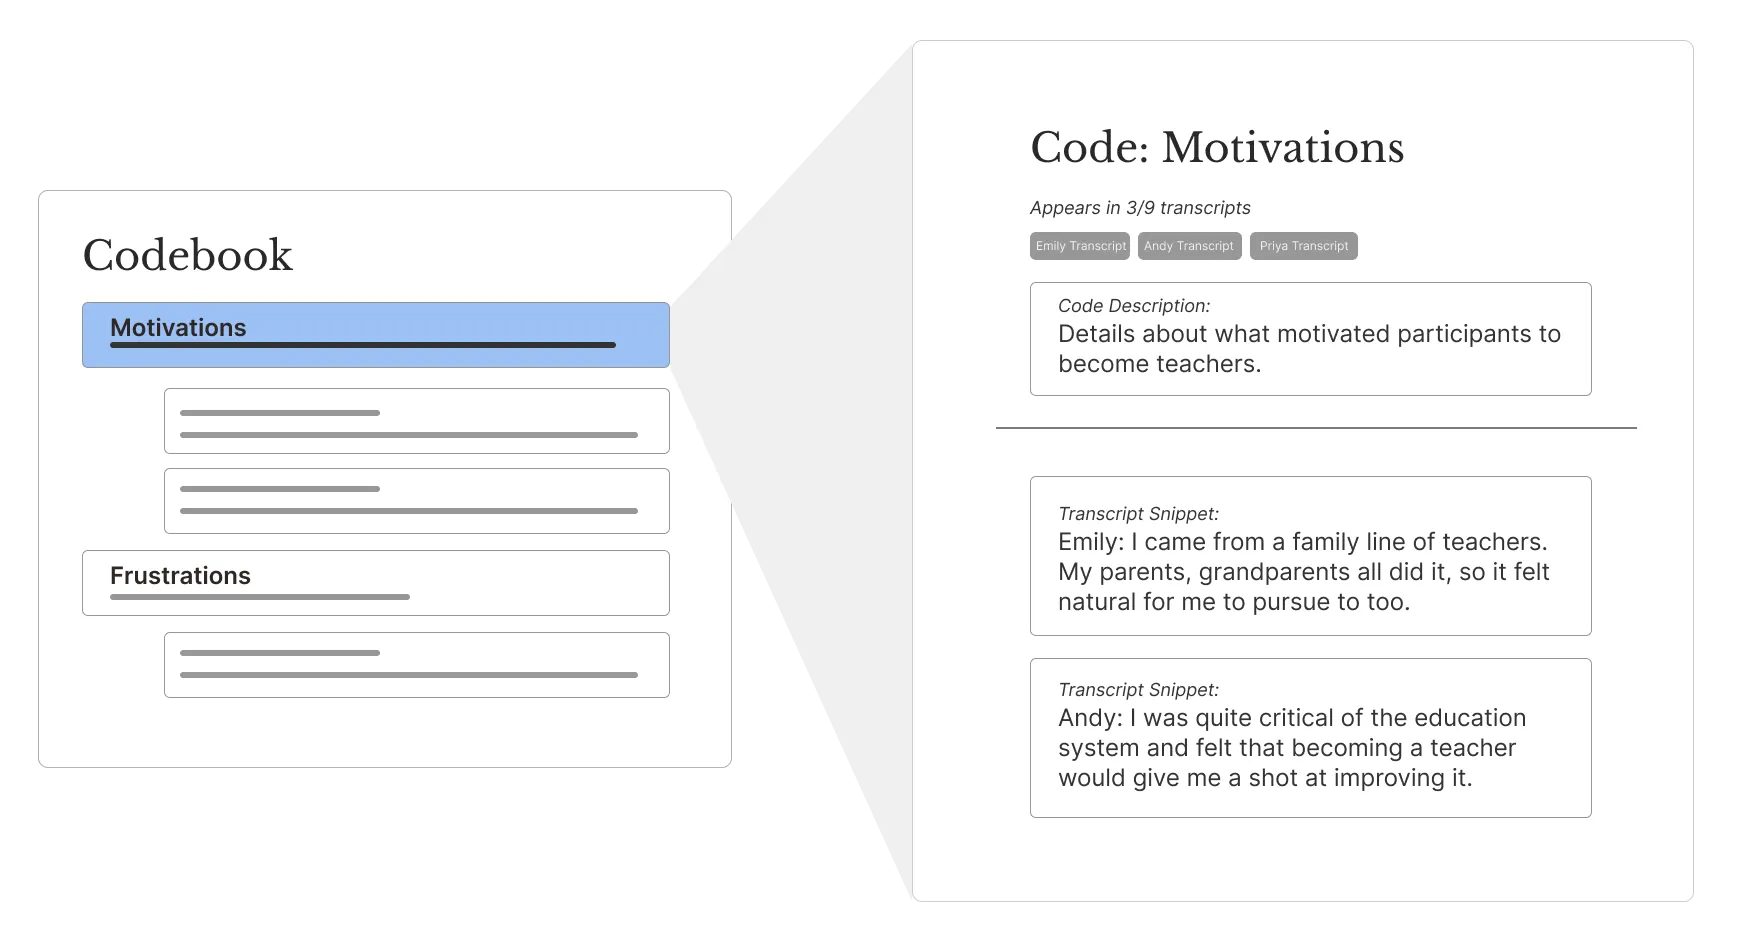
Below is an example of the codes you might identify during initial coding. Each one caught your attention for different reasons, and now it’s time to see how they connect. As you go through your transcripts, you’ll create codes that can be descriptive, conceptual, or even theoretical. You can also use in vivo codes, which are exact participant quotes—an effective way to capture their voices verbatim.
🗃️ Initial coding snapshot – Capturing key experiences
Codes:
- Experiencing a panic attack
- ”Friends created online poker nights”
- Feeling disconnected
- ”Missing my family”
- Nervous about in-person meetups
- ”Wanted a hug”
- Only had the one panic attack
- Past experiences with panic attacks
- Rented an Airbnb
- Scheduling virtual hangouts
- Shortness of breath every day
- Sleeping well on weekends
- ”Zoom dinner club"
- "Wish I had a bigger space”
- Feeling guilty about meeting friends indoors
- ”This is worse than a long-distance relationship”
In a real study, you might identify many more codes than we see here. Using axial coding in the second stage helps you bring order to this unstructured set of open codes–whether it’s a dozen codes or hundreds of them.
Subcategory 1: Causal conditions
In Corbin and Strauss’s (1998) approach, causal conditions are the triggers or reasons behind your main topic—the factors that set things in motion. Although it might seem odd to focus on causes before fully defining the phenomenon, axial coding is iterative, not strictly linear. You have to start somewhere, and we’ve chosen to begin with causal conditions—but this doesn’t lock you into a fixed sequence. Consider this just a starting point.
Either way, the goal for causal conditions is to uncover why participants feel or act the way they do. As you review your codes, look for anything suggesting isolation, uncertainty, or lack of resources—basically anything that might spark or fuel the central event. Ask yourself “What led up to this situation in the first place?”
🔍 Causal conditions – What drives the phenomenon?
Codes:
- “Missing my family"
- "Wanted a hug”
- Feeling disconnected
- ”This is worse than a long-distance relationship”
When you group these codes into a category and revisit the related excerpts, you start to see how they collectively illustrate the impact of isolation and loneliness on participants’ experiences–what you call Lockdown Loneliness.
Causal Condition: Lockdown Loneliness
Isolation and lack of social connection shaped participants’ experiences during lockdown.
Code: “Missing my family”
Definition: Expresses emotional distress from separation, particularly from close family members, during lockdown.
Code: “Wanted a hug”
Definition: Captures the longing for physical closeness, such as hugs or in-person companionship.
Code: Feeling disconnected
Definition: Reflects participants’ sense of detachment from their usual support systems and social circles.
Code: “This is worse than a long-distance relationship”
Definition: Expresses the emotional toll of social isolation, likening it to prolonged physical separation from loved ones.
Remember, you can rename or refine your codes as you gain more insight. In other words, you might notice a cluster of codes (e.g., “Missing my family,” “Feeling disconnected”) that strongly suggest an issue like loneliness or anxiety_,_ even before formally labeling that issue as your phenomenon. There’s no strict order.
Renaming or refining codes can feel overwhelming as your learning grows—especially when you’re juggling dozens of transcripts or working as a team. Delve keeps you organized and updates everyone’s work in real time, preventing duplicate codes or accidental overwrites.
Subcategory 2: Phenomenon
Once you’ve clarified the underlying causes, move on to the phenomenon. This is the central event or experience your participants describe. Essentially, it’s the “what” of your research. Do the codes suggest they’re grappling with severe anxiety, discovering a new sense of community, or radically shifting their daily habits? The phenomenon is the focal point of your analysis, so group all related codes here to capture the core experience unfolding in your data.
⭐ Phenomenon – The central issue in participants' experiences
Codes:
- “Having trouble sleeping”
- Experiencing a panic attack
- ”Nervous about what’s going to happen”
Go back to your excerpts and see how participants are actually talking about these experiences. In Delve, you can filter every snippet or instance of a code in one view to look for ideas. What patterns do you spot when you look at their words side by side? Re-reading snippets can lead to connections you might have missed in earlier coding passes.
Phenomenon: Lockdown Anxiety
Participants’ experiences with anxiety during lockdown were reflected in these codes.
Code: “Having trouble sleeping”
Definition: Describes participants struggling with disrupted sleep patterns caused by anxiety.
Code: Experiencing a panic attack
Definition: Captures moments of acute distress and overwhelming fear experienced by participants.
Code: “Uncertain about the future”
Definition: Reflects participants’ worries about what might happen next, contributing to heightened anxiety.
If you see a category that’s lacking evidence, don’t rush to collect more data. First, review your existing transcripts. You may find details you overlooked. When you’ve genuinely exhausted what you have, then theoretical sampling (doing more interviews or adding other data) is an option. The key is to be strategic and efficient. More data isn’t always the answer, but sometimes, it’s exactly what is needed to fully develop a critical category.
Subcategory 3: Context
Context is about the setting or circumstances in which everything happens. Are your participants living in cramped apartments? Are they juggling childcare or remote work at the same time? Context codes highlight where and how the phenomenon takes place, so you can see whether certain conditions amplify or alleviate participants’ challenges.
You might notice context in codes like:
🏠 Context – Living environment & daily routines
Codes:
- “Wish I had a bigger space”
- Moved back home
- Rented an Airbnb
- Shortness of breath every day
- Sleeping well on weekends
By forming axial codes, you can categorize these patterns and add more context to what they reveal. Delve’s hierarchical filtering lets you view parent codes alongside their subcodes, helping you analyze broad themes while keeping track of the finer details within each category.
Context: Housing setup
Participants’ living arrangements influenced their sense of space, stability, and overall comfort during lockdown.
Code: Small apartment vs. larger spaces
Definition: Participants discussed the impact of living in confined spaces versus having more room to spread out.
Code: Temporary living arrangement (moved or Airbnb)
Definition: Some participants relocated during lockdown, affecting their sense of stability and comfort.
Context: Health & routines
Participants’ physical health and daily habits shaped their overall well-being and stress levels during lockdown.
Code: Respiratory concerns (e.g., shortness of breath)
Definition: Participants reported experiencing breathing issues, adding to their overall stress during lockdown.
Code: Weekend vs. weekday differences
Definition: Routine shifts between weekdays and weekends influenced well-being, sleep quality, and productivity.
Notice we changed some of the code names. It’s good to adjust and modify your codes from open coding as you work through them in the axial coding stage. Because axial coding is an evolving process, you’ll often spot new connections or realize a category needs adjusting as your analysis deepens.
Whether reorganizing Housing setup codes or expanding Health and routines, you want to keep everything flexible enough to evolve yet structured enough to withstand new data. Using a tool like Delve lets you focus on developing your research framework instead of how to keep it all together.
Subcategory 4: Intervening conditions
Intervening conditions are background factors that shape how your participants experience things differently. Did some have a history of panic attacks while others never struggled with anxiety? Watch how introverts and extroverts might adapt differently to isolation. This is where you’re looking for those demographic and historical details that tip the scales in how people respond to the Phenomenon.
In our data, we notice specific initial codes like:
📝 Intervening conditions – Factors that shape experience
Codes:
- Past experiences with panic attacks
- Therapy before COVID-19
- ”Only had one panic attack”
- Introverted vs. extroverted
These intervening conditions, like mental health history and personality traits, could be a way to explain variations in how individuals coped with lockdown.
Intervening conditions: Mental health pre-COVID
Participants’ preexisting mental health conditions influenced how they coped with lockdown stress and uncertainty.
Code: Past panic attacks
Definition: Participants with a history of panic attacks reported increased anxiety and difficulty managing stress during lockdown.
Code: Therapy before COVID
Definition: Participants who had engaged in therapy prior to the pandemic often described having more coping strategies in place.
Code: “Only had the one panic attack”
Definition: A participant’s reflection on experiencing fewer panic attacks than expected during lockdown.
Intervening conditions: Personality
Personality traits shaped how participants adapted to social distancing and isolation.
Code: Introverted vs. extroverted
Definition: While extroverts struggled with limited social interactions, introverts often found lockdown less disruptive to their daily routines.
You start to see that people responded to lockdown differently based on coping strategies, personality traits, and anxiety levels. With Delve’s filtering features, you can quickly compare findings across demographics and descriptors to see how different people navigated these shared challenges. This context helps explain why identical circumstances produced such varied responses among individuals.
Subcategory 5: Strategies
As you’re building other subcategories, you also need to identify strategies—how people actively respond to their situation. Remember, you’ll often move back and forth between these categories as your analysis deepens. In this COVID-19 study, participants tried various approaches to stay connected while managing health risks.
💡 Strategies – How participants responded
Codes:
- Researching how safe restaurants are
- Meeting for park hangouts
- Scheduling virtual hangouts
- ”Friends created online poker nights"
- "Zoom dinner club”
We grouped these as:
Strategies: COVID-conscious socializing
Participants adapted their social interactions while balancing safety concerns and the need for connection.
Code: Attempting safe in-person meetups
Definition: Participants sought ways to interact safely while minimizing health risks.
Code: Park hangouts
Definition: Outdoor spaces were used as a lower-risk setting for socializing.
Code: “Zoom dinner club”
Definition: Groups met virtually over meals to maintain social connections.
Code: Researching safety of indoor gatherings
Definition: Participants sought expert guidance before attending in-person events.
Code: Setting up virtual events
Definition: Online game nights, workshops, and social gatherings replaced in-person events.
What you learn here is that participants toggled between virtual solutions like poker nights on Zoom and cautious in-person meetups (often outdoors) to manage their anxiety while preserving social ties.
Notice a few scattered mentions of in-person meetups? Quickly filter those codes in Delve to see if there’s enough data to form a more detailed subcategory. If not, consider conducting more theoretical sampling to fill that gap.
Subcategory 6: Consequences
Finally, we need to see what happens when participants act on these strategies. Consequences capture the outcomes. These can be good, bad, or somewhere in between. In our data, some participants felt genuine relief from social isolation, while others ended up with new worries:
🔄 Consequences – What happens next?
Codes:
- Zoom burnout
- Nervousness about in-person meetups
- Laughing leading to elation
- Breaking up the day
Some participants felt a measure of relief, while others faced new worries like infection risk or too much screen time:
Consequences: Emotional Benefits and Drawbacks of COVID-19 Interactions
Participants described both positive and negative emotional outcomes from social interactions during the pandemic.
Benefit: Laugh happy
Definition: Participants noted that shared humor and laughter during virtual meetups helped improve their mood.
Benefit: Breaking up the day
Definition: Virtual socializing provided structure, breaking the monotony of lockdown routines.
Drawback: Zoom fatigue
Definition: Frequent video calls led to exhaustion and mental drain, making social interactions feel like work.
Drawback: Fear of exposure
Definition: Anxiety over in-person meetups stemmed from concerns about COVID-19 transmission, even in socially distanced settings.
While “Zoom dinner clubs” and online poker nights helped keep friendships alive, screen fatigue and lingering anxiety about gatherings became unexpected downsides.
Bringing It All Together: Defining the Main Category or Theme
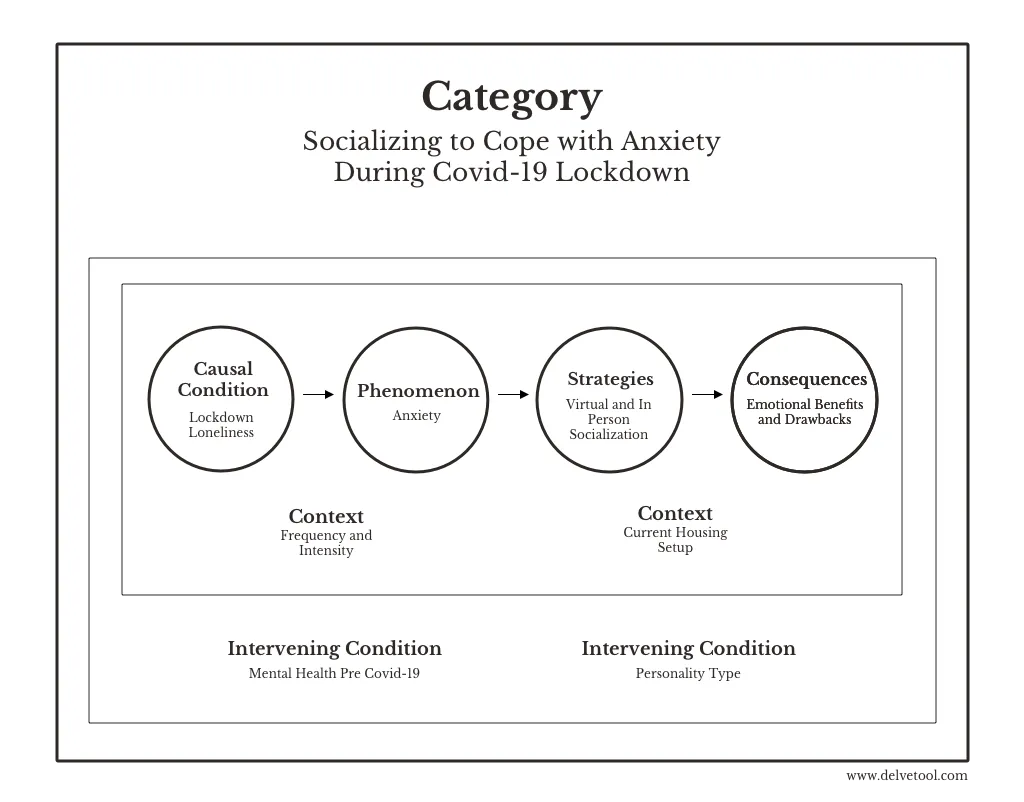
By walking through all six subcategories, you can see the entire picture come into focus:
-
Lockdown loneliness (cause) triggered lockdown anxiety (phenomenon).
-
The severity of that anxiety varied based on context (like home size, health) and intervening conditions (mental health history or personality).
-
Participants used a mix of online and Covid-conscious socializing (strategies) to cope.
-
Those actions led to benefits—like brief relief and laughter—as well as drawbacks, including worry about exposure and “Zoom burnout” (consequences).
A concise way to describe the resulting category might be “Socializing to Cope with Anxiety During COVID-19 Lockdown.” This name captures the core phenomenon (anxiety), how it arises (loneliness), and how people attempt to deal with it (socializing), all wrapped within the unique challenges (consequences) of a global pandemic.
In your write-up, you should be able to explain your findings in 2-3 simple sentences:
This structured perspective clarifies why participants behave a certain way under lockdown and sets the stage for the final coding phase (selective coding) where you integrate everything into a cohesive, research-backed narrative.
Step-by-step guide: How to do axial coding
Below are the steps we followed in our axial coding example. We’ll walk you through how we took scattered initial codes and turned them into something more coherent. You can do this with pen-and-paper, spreadsheets, or a qualitative data analysis coding tool—whatever fits your style and data size.
Step 1: Revisit your initial codes
Before diving in, round up every code, memo, or sticky note from your initial coding phase. If you’re using Delve, open your project’s codebook for a quick and easy overview of all your codes in one place. Read through them again—sometimes a second look highlights patterns or gaps you missed earlier. Note any potential blind spots or questions so you can address them or possibly collect more data later.
Step 2: Combine and organize similar codes
Look for duplicates or near-duplicates and group them into higher-level categories. For instance, “Trouble sleeping” and “Restless at night” could merge into “Sleep disturbances.” Don’t worry if you’re not certain where a code should live. Axial coding evolves as you refine your categories. Place each code where it seems to fit now and be prepared to move it later if it aligns better elsewhere.
Remember, axial coding rarely follows a neat checklist. You’ll likely circle back to refine subcategories, update code names, or even add new codes as your analysis deepens. Delve lets you rearrange, group, rename, and memo all in one place, so you never lose track of how your categories evolve.
Step 3: Ask the “axial” questions
Revisit Corbin and Strauss’s six elements and assess which codes answer each question. For example, which codes explain why the phenomenon happens? Which details how people respond, or what outcomes they experience?
-
Phenomenon: The central issue (e.g., anxiety)
-
Causal conditions: What leads to it (e.g., lack of physical connection, fear of infection)
-
Context: Specific circumstances (e.g., tiny apartment, no outdoor access)
-
Strategies: How participants respond (e.g., virtual game nights, phone calls)
-
Consequences: Results (e.g., temporary relief, Zoom fatigue)
-
Intervening conditions: Broader factors influencing it all (e.g., age, mental health history, Wi-Fi access)
Quickly filter or search those codes in Delve to see if there’s enough data to form a more detailed subcategory. If not, consider conducting theoretical sampling to fill that gap.
Step 4: Refine and memo
As you group codes, continue jotting down memos explaining why certain codes belong together or how you merged them. These brief notes provide a clear audit trail of your evolving insights. If you notice recurring patterns – like specific codes frequently co-occurring – mention that in a memo, too. They’re especially helpful in justifying your decisions to collaborators or returning to your analysis after a break.
Whether you’re tracking co-occurring codes or refining axial categories, Delve’s ANY/ALL filtering logic lets you toggle between broad and specific intersections to surface meaningful connections.
Step 5: Iterate
You might re-merge categories or discover new relationships as you analyze more transcripts or hold team discussions. Axial coding isn’t a single pass and will evolve with a better understanding of the data. Regularly consult your memos to see if you’ve addressed all outstanding questions, including any that prompt theoretical sampling. With Delve, keeping everything updated is far less cumbersome, so you can focus on refining your insights rather than juggling multiple documents.
By following these steps, you’ll see how axial coding can turn a scattered list of codes into a structured framework that sheds real light on your data. You use pen-and-paper or spreadsheets, but a web-based tool like Delve makes it easier to collaborate on a larger project and track every change.
What next? Moving on to selective coding or theme development
Axial coding is where your research begins to take real shape. By this point, you have an intimate understanding of your data and have a bigger picture in mind. After refining your categories, you’re ready for the final stage:
-
Selective coding (in grounded theory): Integrate your core categories into an overarching theory or conceptual framework.
-
Theme development (in thematic analysis): Combine these categories into meaningful themes that answer your research questions and relate back to your literature review or conceptual model.
The organization and clarity of axial coding make these final steps more straightforward. They confirm you haven’t overlooked critical relationships in the data. Whatever your approach, a clear plan and consistent process helps you avoid many of the common challenges you’ll face along the way.
Common challenges and best practices for axial coding
Even with a solid process in place, axial coding brings its own hurdles. Below are some of the common challenges you’ll encounter, along with practical tips to address them. Adopting these best practices—whether you use basic tools or an online tool—can help you stay organized and move confidently toward deeper insights.
1. Challenge: Too many possible connections
Axial coding can feel like sorting a massive puzzle, with every code potentially linking to multiple others.
Best practice:
-
Focus on the strongest, most supported connections.
-
Use Delve’s various filter and sort features to see subsets of codes.
-
Keep a memo log of each connection to revisit if needed.
2. Challenge: Inconsistent coding across team members

Different researchers may group codes differently, leading to confusion.
Best practice:
-
Use Delve’s coding comparison feature to compare coding side by side.
-
Set up regular check-ins where you clarify how categories are forming.
-
Rely on a shared codebook that everyone updates and references.
3. Challenge: Knowing when to move on

You might get stuck perfecting every link and worry you haven’t mapped all relationships. While axial coding isn’t a linear process, you can only move on with a coherent structure addressing your research questions. In grounded theory, this is called theoretical saturation, meaning adding new information doesn’t change the results.
Best practice:
-
Remember that axial coding is iterative. Move on when you have a coherent structure that addresses your research questions.
-
Use filtering to validate completeness**.** Filtering by code or participant group in Delve helps you check if key themes are fully developed or if additional data is needed to refine your analysis.
-
Leave room for new patterns to emerge in later stages or new data collection.
Accelerate your axial coding with Delve

If you’ve tried axial coding with pen and paper or spreadsheets, you know how quickly things get messy. That’s why a flexible qualitative coding tool like Delve can be a game-changer:
-
Smart code organization: Structure your codes to reflect relationships and hierarchies, with changes instantly updating across your project
-
Layered coding structure: Build meaningful connections between codes, showing how they relate to your central categories during axial coding.
-
Integrated memo system: Add memos to codes with thoughts on causal relationships, context, or intervening conditions–no separate documents needed.
-
Team collaboration: Invite colleagues to view, code, and annotate in real-time, minimizing confusion over who changed what and why.
-
Powerful filtering: Identify patterns quickly by filtering codes or searching for keywords in your transcripts.
Customers give Delve top marks because it streamlines axial coding. See firsthand how it helps keep your codes and categories organized, whether exploring the causes of lockdown anxiety or analyzing any other qualitative data set.
References
-
Corbin, J., & Strauss, A. (1998). Basics of Qualitative Research: Techniques and Procedures for Developing Grounded Theory (4th ed.). SAGE Publications.
-
Corbin, J., & Strauss, A. (1990). Grounded theory research: Procedures, canons, and evaluative criteria. Qualitative Sociology, 13, 3-21.
-
Saldaña, J. (2009). The Coding Manual for Qualitative Researchers. Sage Publications Ltd.
Cite This Article:
- Delve, Ho, L., & Limpaecher, A. (2025, February 27). How To Do Axial Coding. https://delvetool.com/blog/axialcoding