This is part of our Ultimate Guide to Qualitative Software | Start a Free Trial of Delve | Take Our Free Online Qualitative Data Analysis Course
Pairing a survey with interviews is common in mixed methods research, where one study combines numerical data with people’s own words. The challenge for many researchers is bringing those quantitative and qualitative sets of results together. Convergent parallel design handles this by collecting both at the same time, analyzing each on its own, then comparing the results.

In a convergent study, the qualitative work means coding interviews, and open-ended survey answers if you have them, into themes you can compare with your quantitative results. A web-based qualitative tool like Delve lets you do that coding in one project. You code interview transcripts and open-ended survey responses side by side, and every theme stays linked to its quotes.
What is convergent parallel design, and how does it work?
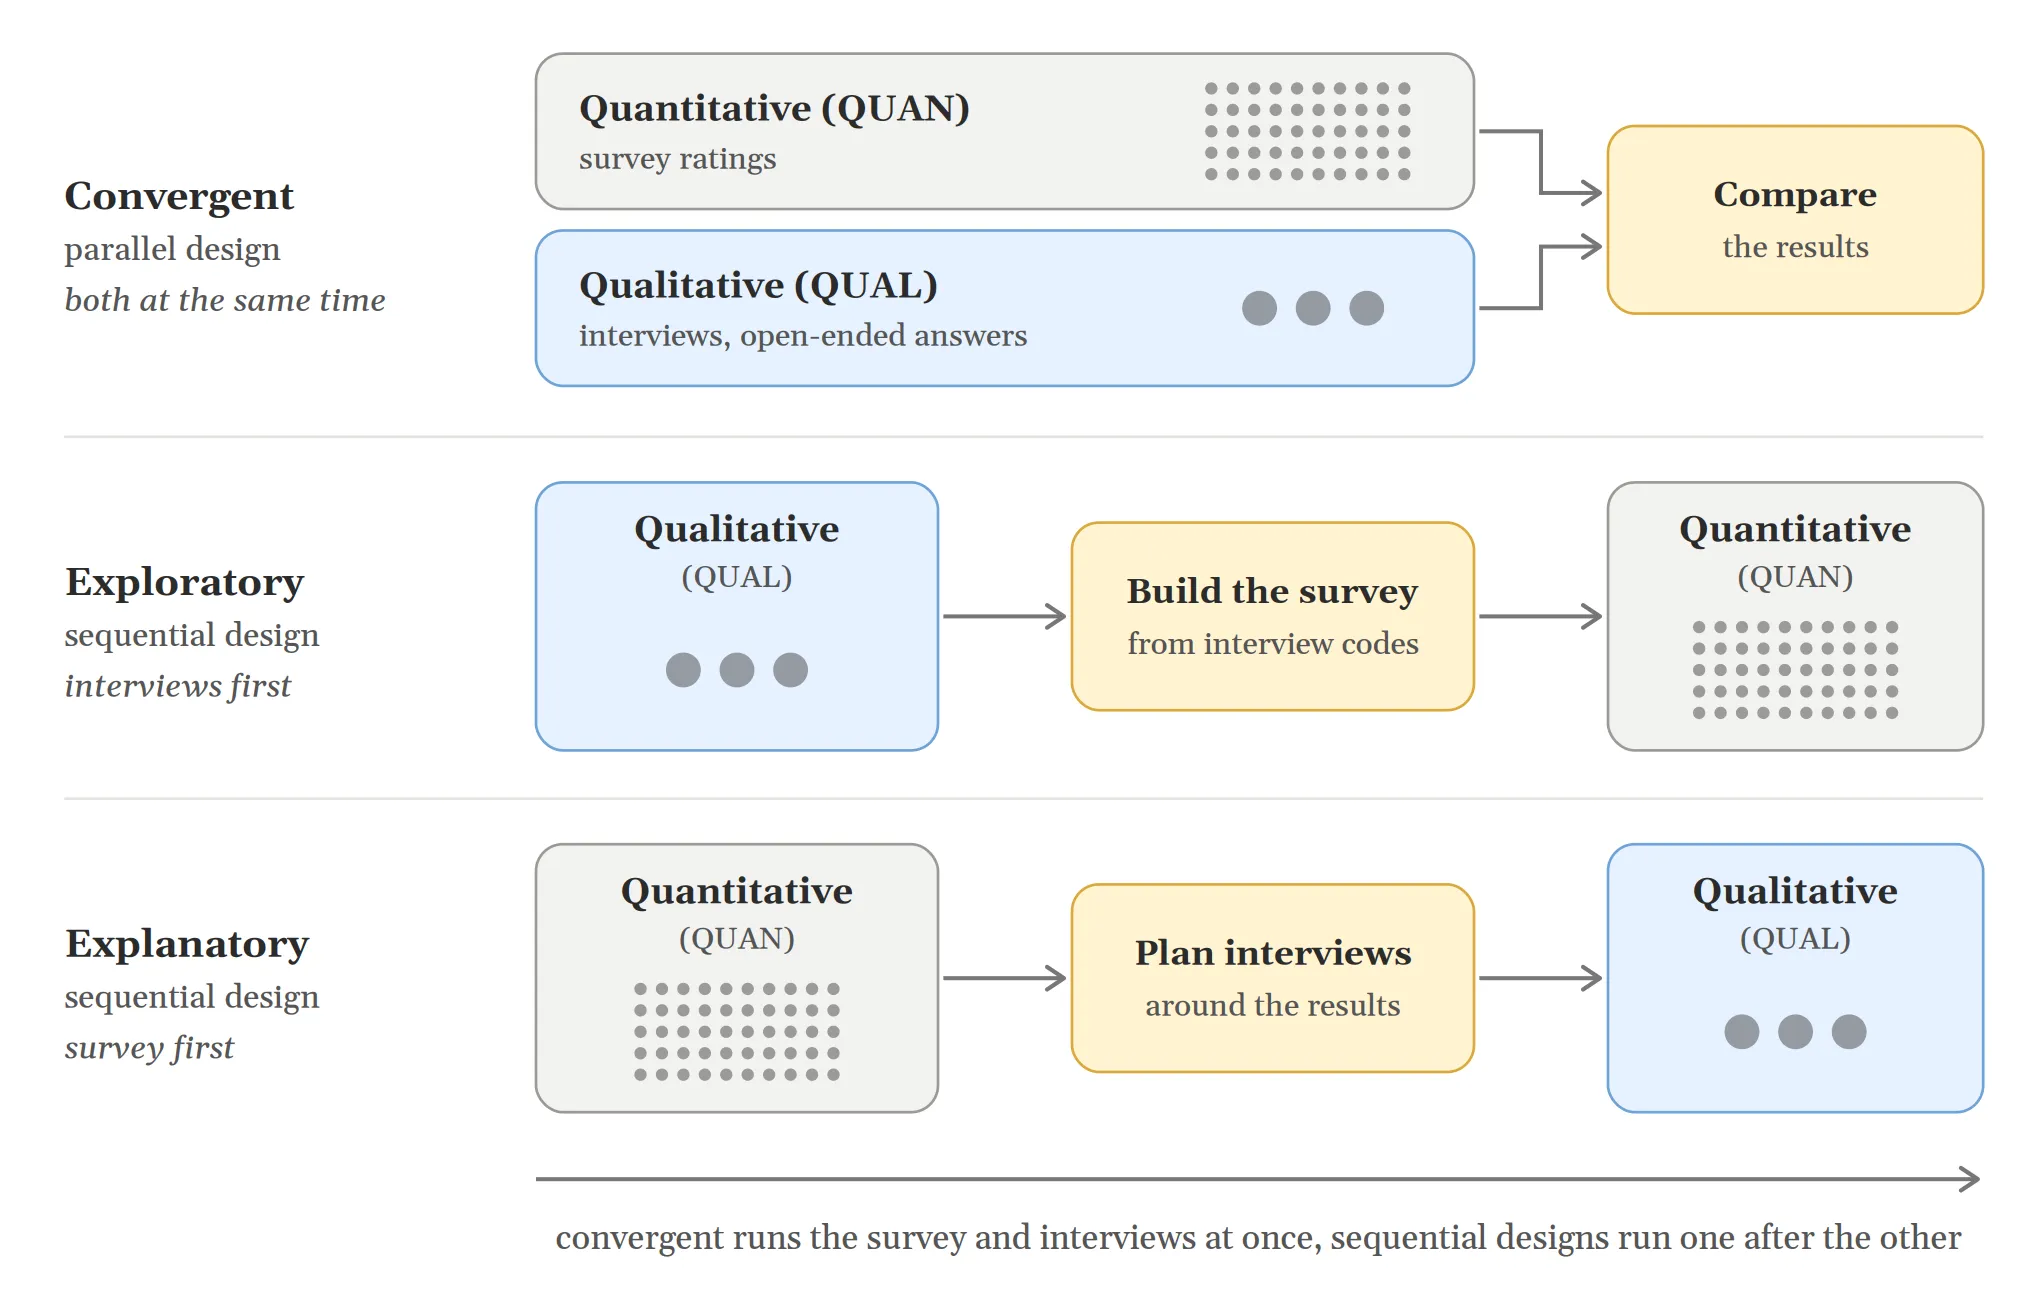
Convergent parallel design is a mixed methods design where you collect quantitative data and qualitative data at the same time, analyze each on its own, then bring the results together. As the name suggests, the two halves run in parallel, side by side, and converge at the end, when you compare the results.
.BqjO-gL6_Z1eVuSY.webp?dpl=dpl_ERESCkC5BzAKyvG6TjTCMrMtYS2C)
The final comparison is one form of what mixed methods researchers call integration. Fetters, Curry and Creswell (2013) show the process in Achieving Integration in Mixed Methods Designs. They call this comparison merging, and they recommend planning it alongside the study. Before data collection starts, you can still shape what the survey asks and what the interviews cover so the two line up better.
In our advising study example, convergent design plays out in three steps:
- Collect both at once. The survey goes out to 400 students while you interview 20 of them during the same term. You write the interview questions before any survey results come in, so neither round of data collection waits on the other. Your 20 interviewees can come from the 400 survey respondents, which lets you compare the same students’ ratings and accounts later.
- Analyze each separately. You run statistics on the survey ratings to see how students scored the service. You code the interview transcripts and the open-ended survey answers, then group the codes into themes. In Delve, you nest related codes under a broader theme as patterns appear. Each analysis reaches its own conclusions before you compare them.
- Compare and interpret. You take each theme and look at the survey statistic on the same topic, such as the follow-up theme next to the follow-up rating. Then you ask three questions. Where do the two agree? Where do they differ? What does one show that the other missed? The answers become your findings, and this step is the merge Fetters and colleagues describe.
Creswell and Plano Clark first called this the triangulation design in 2007, after triangulation. Triangulation just means confirming a finding with more than one kind of evidence, such as numbers and interviews in this case. The 2011 edition renamed it the convergent parallel design.You will also see it called the convergent design or the concurrent design.
How convergent design compares with sequential designs
Fetters and colleagues describe three basic mixed methods designs, and the main difference is timing. A convergent design collects survey and interview data at the same time. An exploratory sequential design runs interviews first and uses them to build a survey. An explanatory sequential design runs a survey first and uses interviews to explain the results.
| Design | Order | Choose it when |
|---|---|---|
| Convergent parallel | Survey and interviews at the same time | You want both answers at once and plan to compare them |
| Exploratory sequential | Interviews first, then a survey built from them | You don’t yet know what to measure |
| Explanatory sequential | Survey first, then interviews to explain it | You have results that need explaining |
Our guide to exploratory versus explanatory sequential design compares the two sequential options. Once you choose a convergent design, you collect both kinds of data, run statistics on the ratings, code your transcripts (and open-ended answers) and group the codes into themes through thematic analysis or another method. You then compare the themes with the statistics and write up the combined findings.
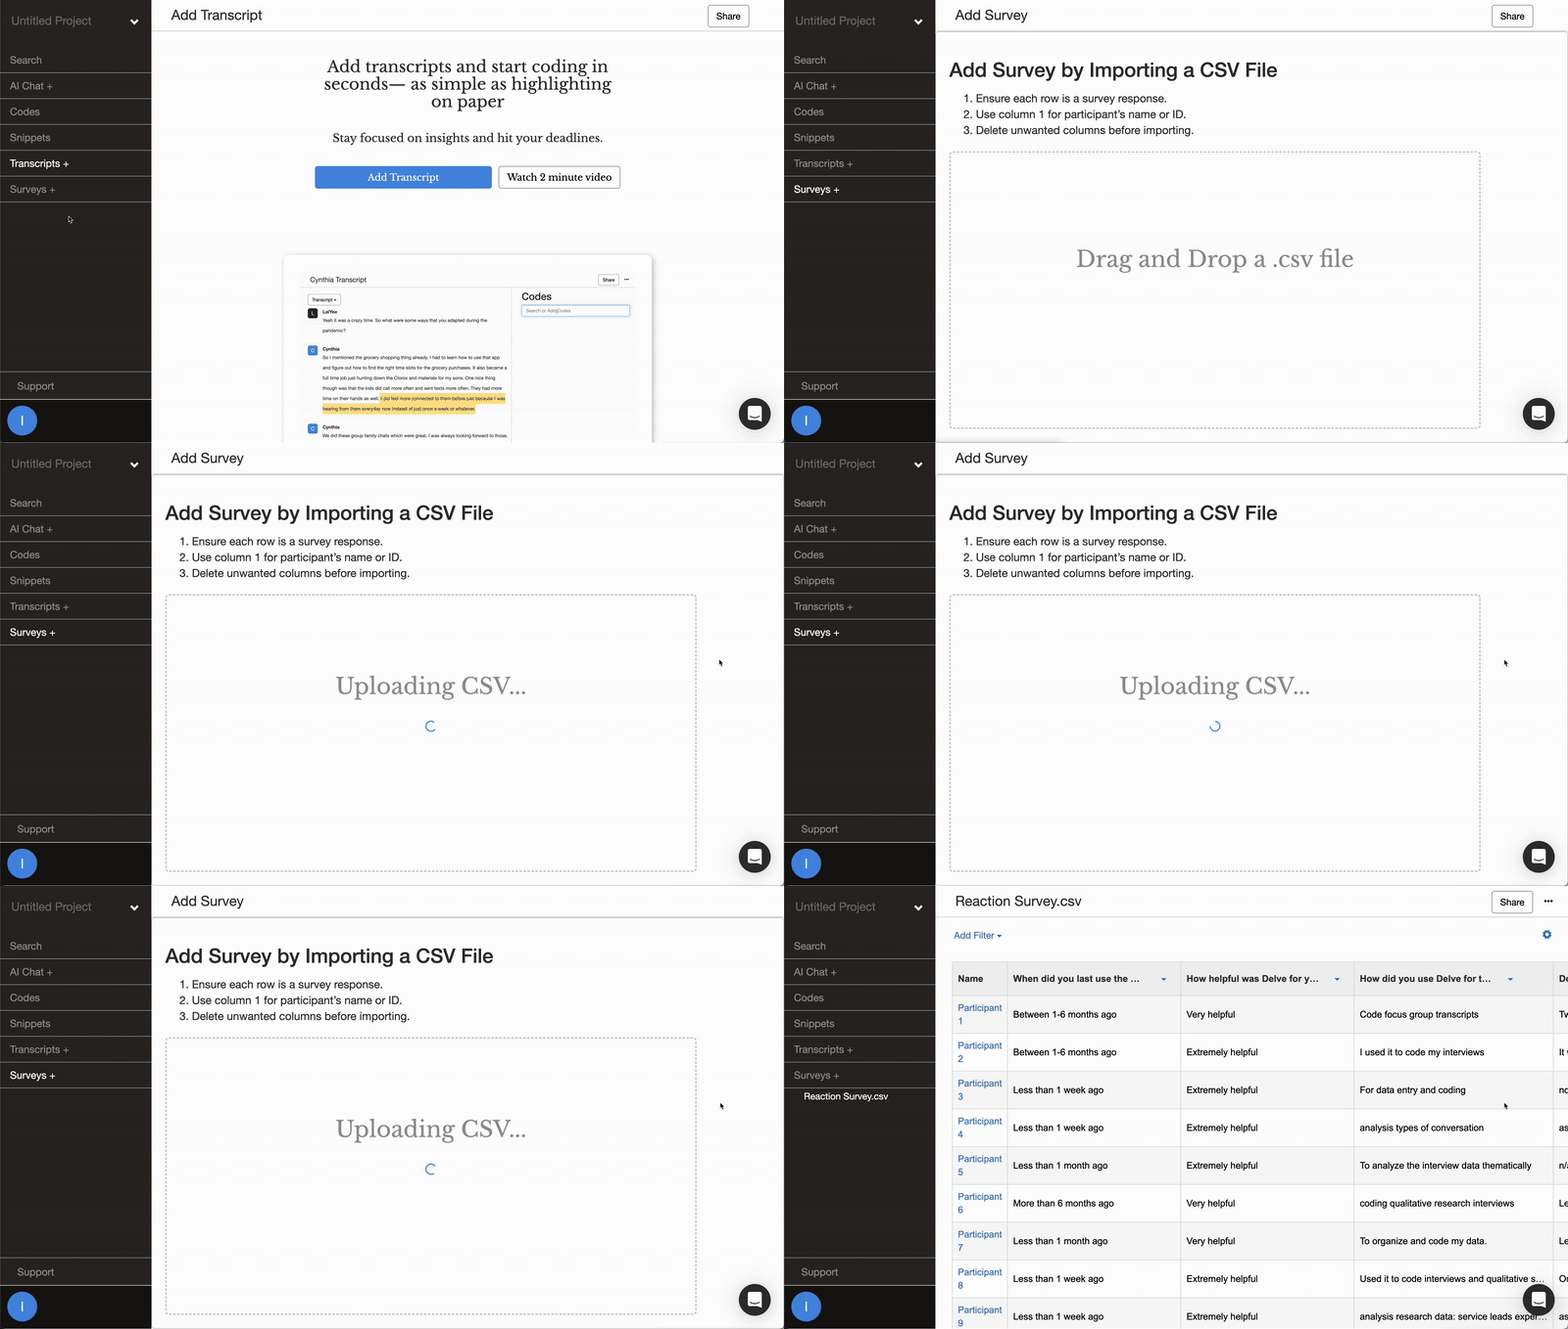
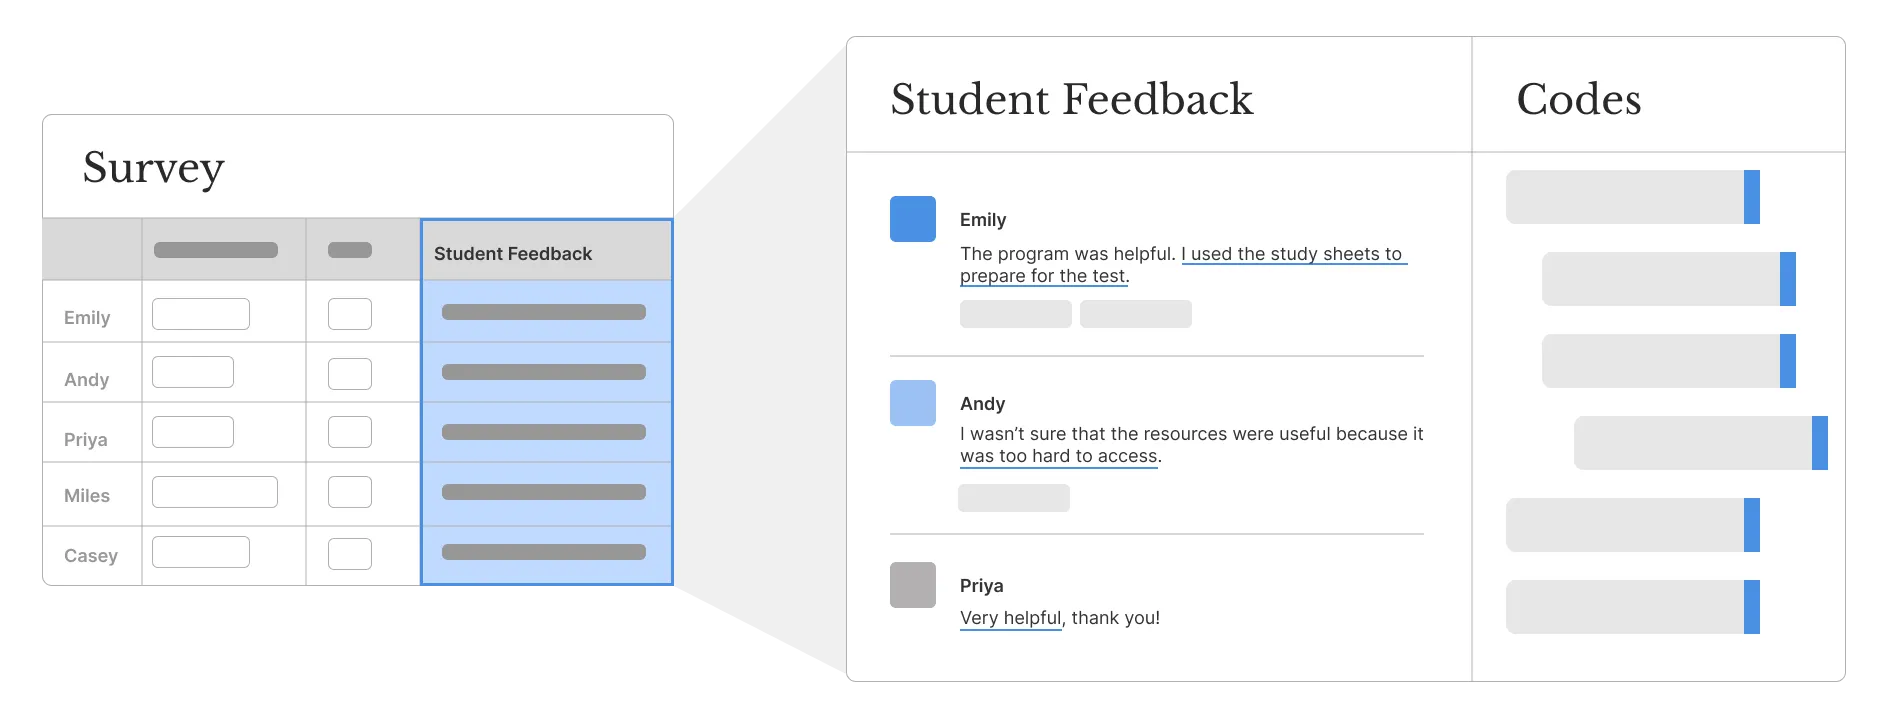
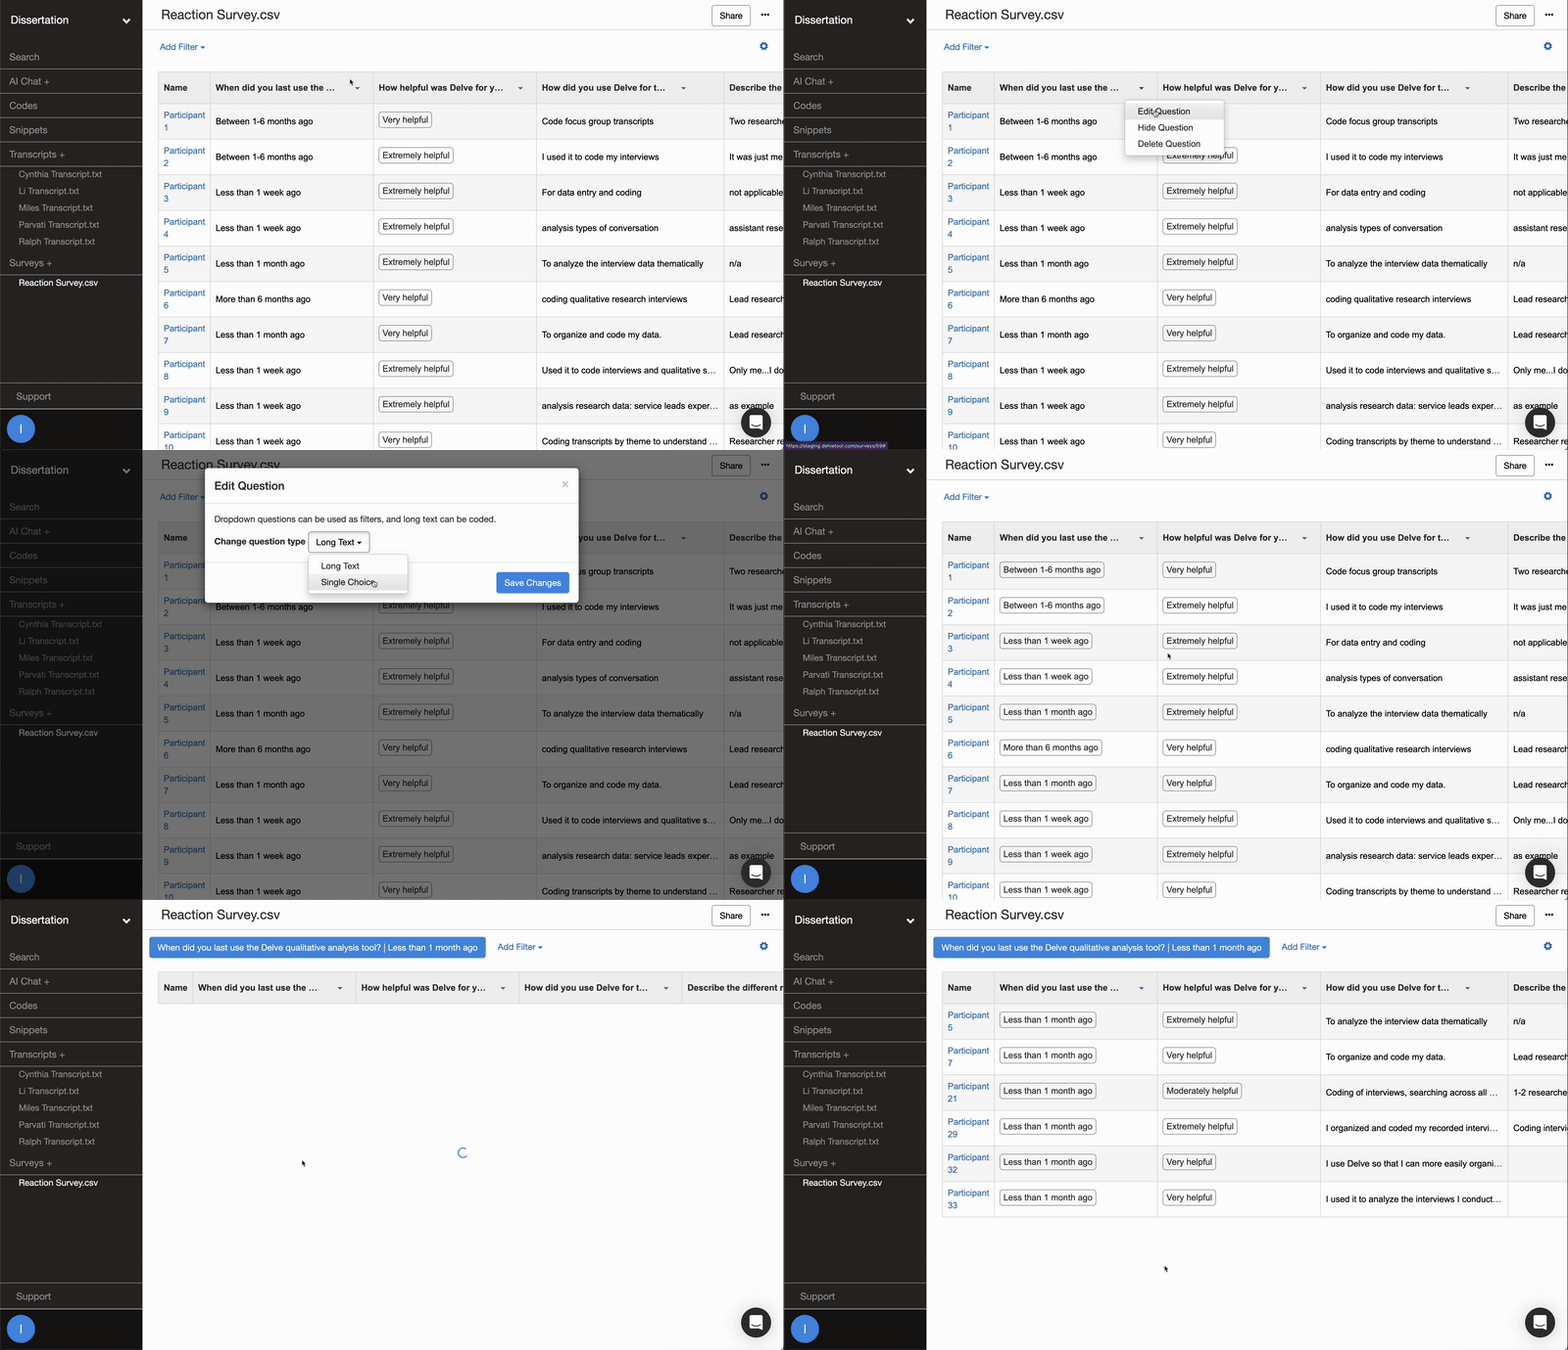
The coding step can be a messy process. Transcripts end up in one folder and hundreds of open-ended survey answers in a spreadsheet. In the Delve qualitative analysis tool, you can upload your full survey, ratings and open-ended answers together, into the same project as your transcripts. You then code the open-ended answers and the transcripts under one codebook, which we’ll walk through later in the article.
When should you use convergent parallel design?
Creswell and Plano Clark explain convergent design as a way to see one problem from two sides, in numbers and in people’s own words. They suggest the convergent route when:
- Both kinds of data carry equal weight. You want to measure how widespread an experience is and understand how people describe it, with neither answer playing a supporting role.
- You have one window to collect data. A program ends, a cohort graduates, or funding covers a single round of fieldwork, so the survey and interviews need to happen together.
- You want to compare the findings directly. Fetters and colleagues note that when the survey ratings and your themes reach the same conclusion, that conclusion gains credibility. When the two differ, the gap points to something one method may have missed.
The college advising study fits all three. The office needs both the ratings and the reasons behind them, and many students will graduate before a second round. If you don’t yet know what to ask, or you already have results that need explaining, one of the sequential designs above is the better fit.
How to line up your survey and interviews before you collect
The comparison works when the survey and the interviews ask about the same things. Before collecting anything, build your survey and your interview guide around one shared set of topics, three or four at most. In the advising study, the topics are scheduling, the quality of advice, and follow-up. Each survey question, rating or open-ended, sits under one topic, and your codes grow under the same headings.

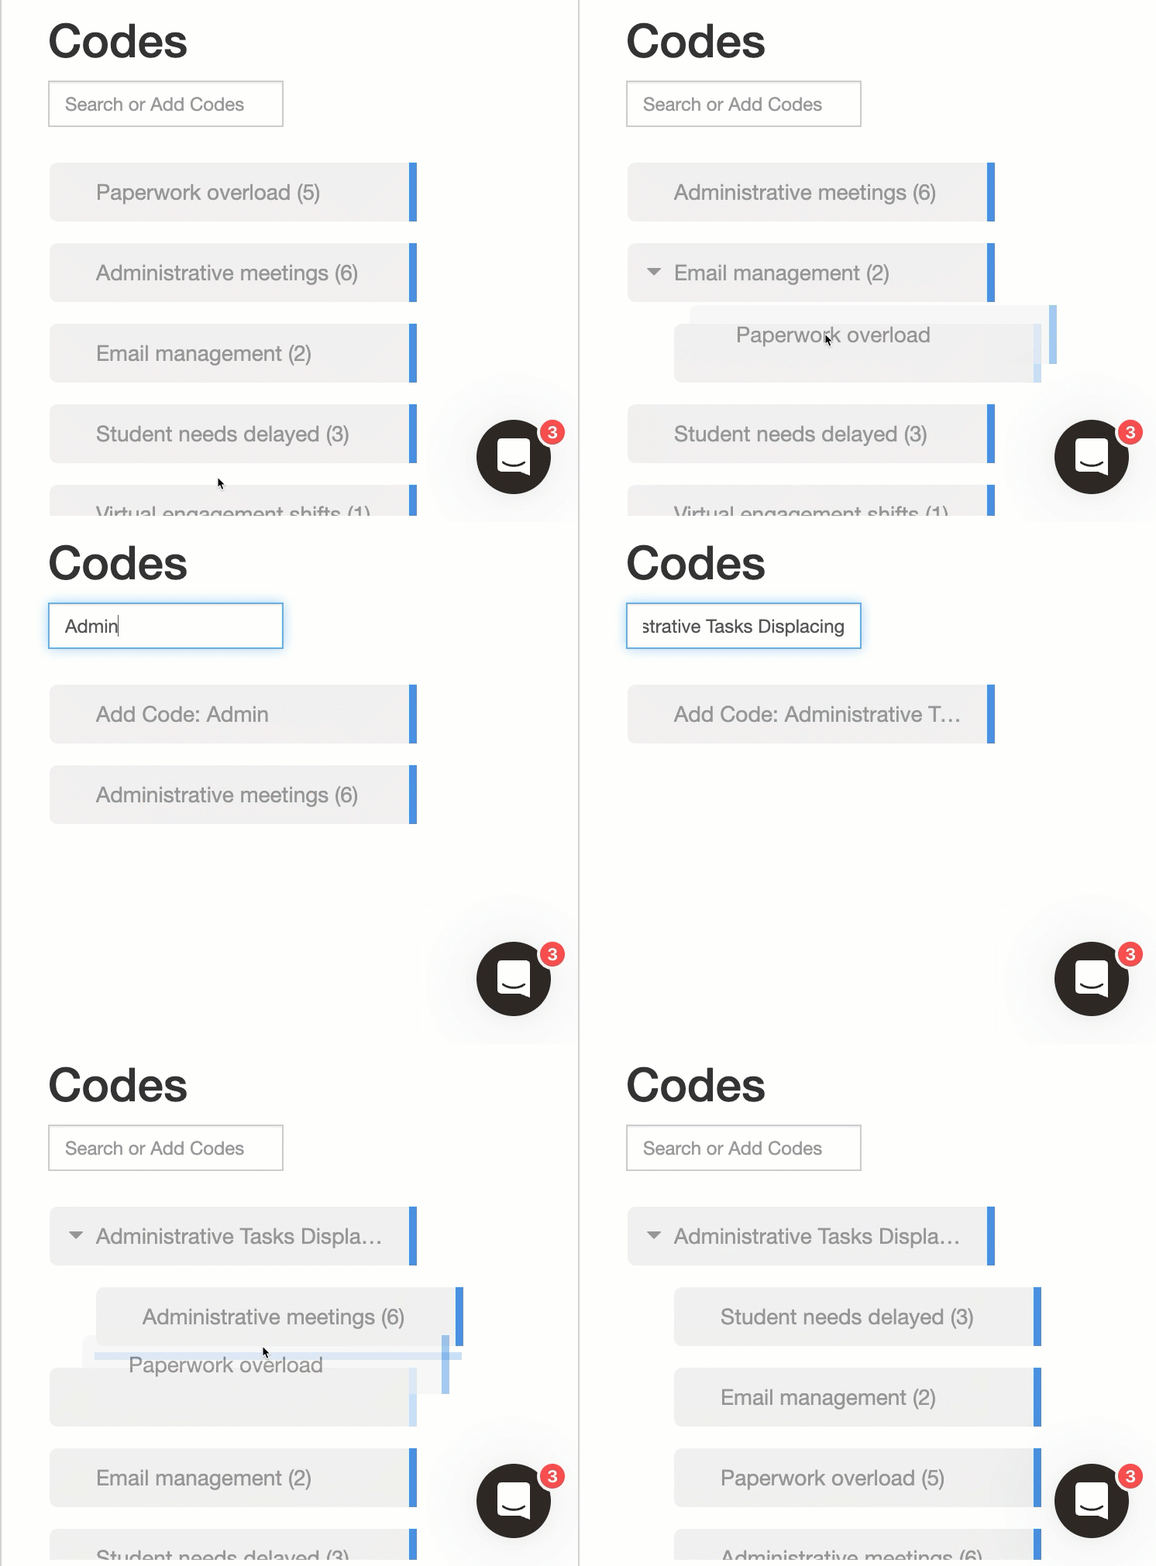
A qualitative tool like Delve lets you set those topics up as parent codes before you open your first transcript, giving you a deductive starting point. As new codes appear, you can nest them under the topic they belong to, so the structure you planned stays visible while your codebook grows.
Coding interview transcripts and open-ended survey answers with one codebook keeps all your qualitative findings under the same topics as your survey ratings. Here is an interview quote and an open-ended survey answer from the advising study, coded with the same codebook.
Interview: "Nobody checked in after. I had to email twice to find out what happened to my form."1 Open-ended survey answer: "The advice itself was great,"2 "but I never heard back about my petition."1
Codes:
1 Follow-up gap – no contact after the meeting, student had to chase the outcome
2 Helpful advice – student valued the guidance given during the meeting
In Delve, you code part of an open-ended answer the way you would code a sentence in an interview. The Follow-up gap code now holds a passage from an interview and a phrase from a survey answer, so every passage that could explain a low follow-up rating sits in one place.
Three ways your survey and interview findings can fit together
Once both your quantitative and qualitative analyses are finished, you can compare the results side by side. Fetters and colleagues describe three ways the survey statistics and your themes can fit together.
- Confirmation. The ratings and your themes point to the same finding. Students rate follow-up low, and their interviews and open-ended answers describe chasing their own outcomes after a meeting.
- Expansion. One source shows something the other can’t. Interviewees describe advising as the place they learned they belonged on campus, and the survey has no question about belonging.
- Discordance. The ratings and your themes point to different findings. First-generation students rate advising the same as everyone else, yet first-generation interviewees describe hesitating to book a second appointment.
Disagreement is a normal outcome of a convergent study, and you can report it as a finding. Fetters and colleagues suggest looking for its source, such as who was sampled or how a survey question was worded. Rereading what one group said often helps.
Delve lets you tag each transcript with a descriptor, a label such as year of study or first-generation status, then filter your coded passages to read only what first-generation students said about follow-up.
What is a joint display, and how do you build one?
A joint display is a table that puts your themes and the related survey statistics side by side. You assign one row per theme, with a column for what the comparison shows. Fetters and team describe it as a visual way to draw out insights beyond what either set of results offers alone. For the advising study, a joint display might look like this. The figures are illustrative.
| Qualitative theme | Related survey rating | What the comparison shows |
|---|---|---|
| Fast scheduling, students got appointments sooner than expected | Ease of scheduling rated 4.4 out of 5 | Confirmation. The ratings and the interviews agree scheduling works well. |
| Follow-up gap, students chased their own outcomes | Follow-up rated 3.1, against 4.3 for the advice itself | Confirmation. The interviews explain what the lower rating consists of. |
| First-generation students hesitated to book a second appointment | No difference in ratings by first-generation status | Discordance. The ratings miss a barrier the interviews found. |
| Advising helped students feel they belonged on campus | No survey question about belonging | Expansion. Only the interviews reached this topic. |
Dissertation committees, journal reviewers, and others reviewing your work use the joint display to check your reasoning. For each row, they should be able to find the quotes behind the theme and the survey rating you compared it with.
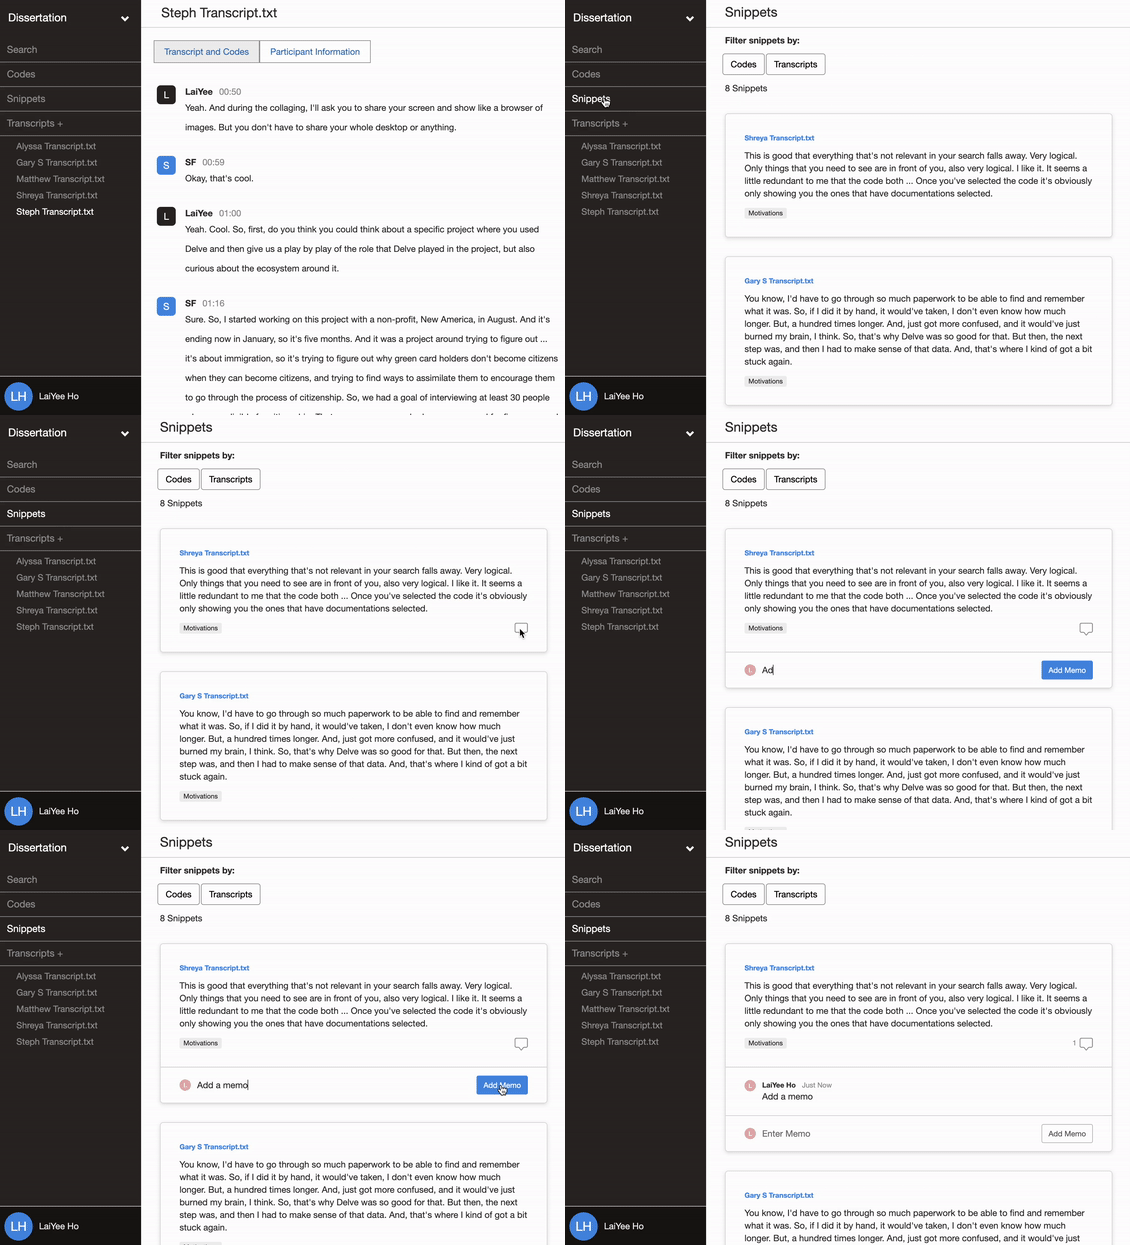
In Delve, you can open the Follow-up code to see every quote you coded under it, from interviews and open-ended answers together. You can also add a memo to the code noting why you matched it with the follow-up rating, which helps you pick back up with the thought in your write-up.
Real example of convergent parallel design in a health care study
Marcela Mazo Canola and colleagues used a convergent parallel design to study how patients with triple-negative breast cancer move from first symptoms to treatment. They interviewed 42 patients and analyzed insurance claims (the billing records insurers keep) for 6,345 patients, then compared the interview themes with the claims data in a joint display.
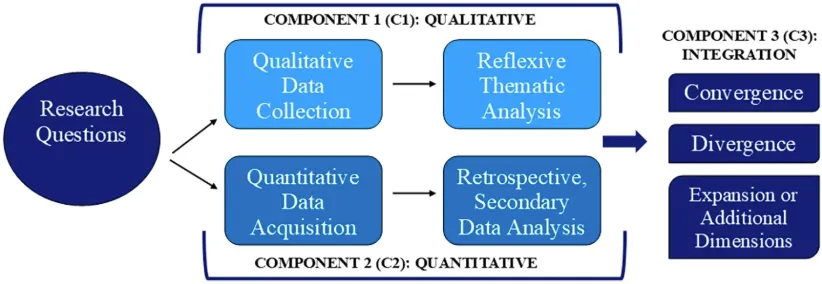
Source: Figure 1 from Mazo Canola et al. (2026), the convergent parallel design used in their triple-negative breast cancer study. Reproduced from Frontiers in Oncology under a CC BY 4.0 license.
The interviews. Rebekkah Schear, the study’s corresponding author, coded all 42 transcripts in Delve using reflexive thematic analysis and developed nine themes. Patients described symptoms being brushed off, confusing conversations at diagnosis, insurance hurdles, and poorly coordinated care. One patient’s doctor told her “you’re so young, you shouldn’t have breast cancer,” which delayed her tests.
The claims data. For patients in Medicaid managed care plans, the adjusted wait for treatment given before surgery averaged 44.2 days for White patients, 63.2 days for Hispanic and Latina patients, and 82.1 days for Black patients.
The authors sorted their comparison into convergence, divergence, and expansion, which match the confirmation, discordance, and expansion outcomes Fetters and colleagues describe.
- Convergence. The longer waits in the claims data matched patients’ accounts of dismissal and insurance obstacles.
- Divergence. Rural patients showed no treatment delay in the claims data, yet rural interviewees described isolation, limited local expertise, and no nearby clinical trials. The authors read the gap as a limit of what billing records capture.
- Expansion. Emotional strain, feeling unseen by clinicians, and feeling unprepared for side effects appeared only in the interviews.
The published joint display runs all nine themes against the claims results, one row per theme, and the first five rows appear below. Each row pairs a theme with the related claims results, then notes where the two converge, where they diverge, and what the interviews added.
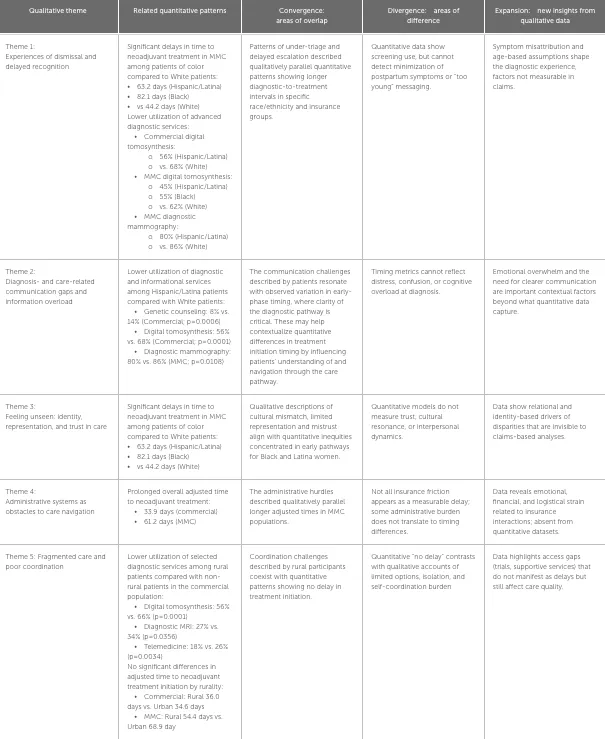
Source: Excerpt from Table 5 in Mazo Canola et al. (2026), showing five of nine themes. Reproduced from Frontiers in Oncology under a CC BY 4.0 license and cropped from the original.
Because the interviews were coded in Delve, each of the nine themes in this table stays tied to the patient quotes behind it, so every row can point back to what patients said. You can read the full study in Frontiers in Oncology or browse other mixed methods studies that used Delve.
Common challenges in convergent design, and where coding software helps
Integration is the step where many mixed methods studies come up short. Fetters et. al. note that combining qualitative and quantitative data can add a great deal to a study, yet many mixed methods studies integrate the two only to a limited extent. The problems usually show up at the comparison, months after the data came in:
| Challenge | Best practice | How Delve helps |
|---|---|---|
| The survey and interviews weren’t designed to be compared | Build both around the same few topics before collecting data | Nest codes under the topics your survey already uses |
| Transcripts and open-ended answers live in separate files | Keep all your qualitative data in one place | Code open-ended survey responses in the same project as your transcripts |
| A survey rating for one subgroup needs explaining | Record which group each participant belongs to | Filter snippets by code and participant to read one group at a time |
| Reviewers can’t see how a theme connects to a number | Write down your reasoning while you code | Memos keep that reasoning attached to the snippet that prompted it |
| Two researchers code the same transcripts differently | Compare coding early and discuss the differences | Coding comparison shows passage by passage where team members differed |
What if you want everything first-generation students said about follow-up? In a spreadsheet and Word documents, that means copying and pasting back and forth. In Delve, you filter your coded snippets and survey rows to first-generation students and read their interviews and open-ended answers together.
Bring your survey and interview findings together with Delve
By the end of the term in the advising study, you have 400 survey responses and 20 interview transcripts. You run statistics on the ratings in your statistics software. The full survey and the transcripts go into one Delve project, where the open-ended answers and transcripts share one codebook and you can filter to one group of students at a time.
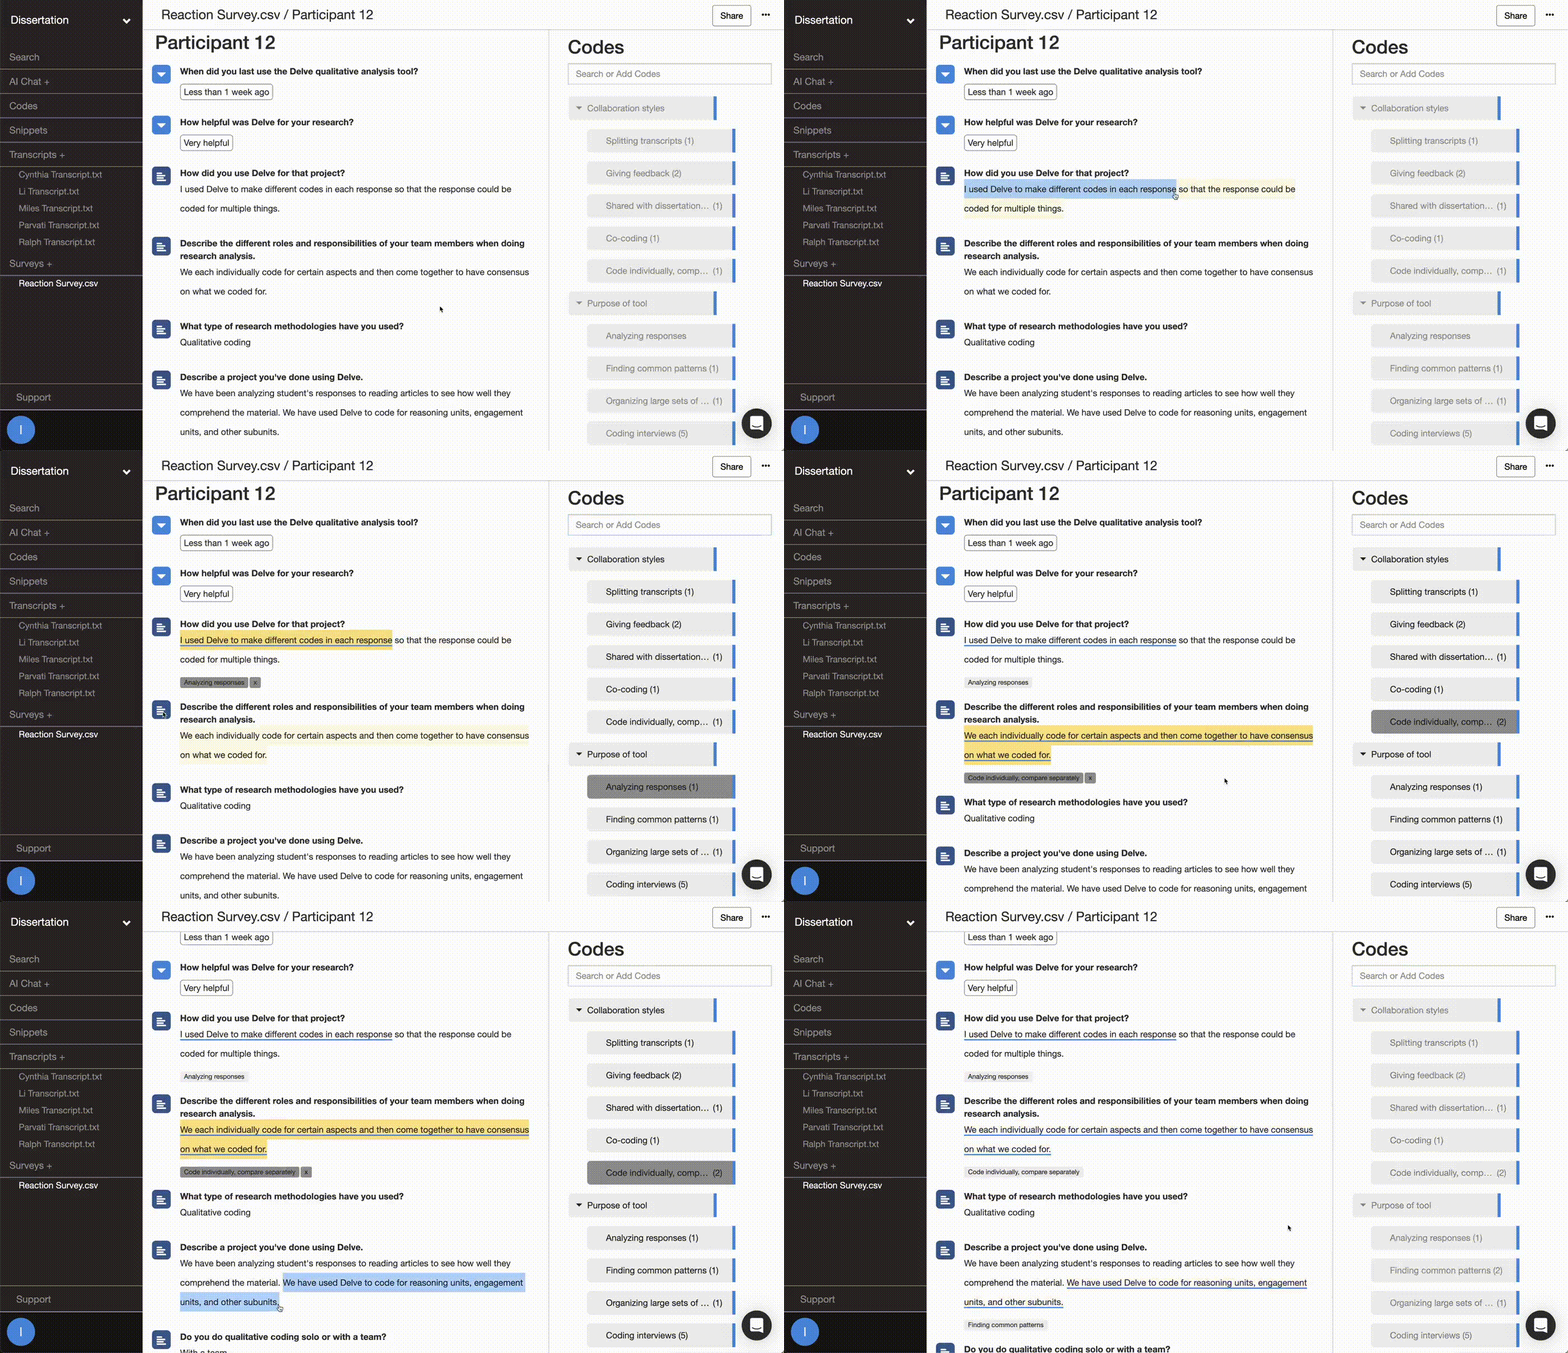
Delve also has an AI chat that works with the passages you’ve coded, from interviews and open-ended survey answers alike. Choose the codes or transcripts you want it to draw from, then ask it to summarize a theme, pull example quotes, or lay out your findings in a table. You review what it gives you and decide what goes into your joint display.
In the college advising study we followed, the survey ratings show how many students felt the follow-up gap, and the interviews and open-ended answers show what that gap was like for them. A convergent design gives your reader both. Start a free trial of Delve and compare your interview and survey coding.
Frequently asked questions
What is a convergent parallel design in mixed methods research? A convergent parallel design is a mixed methods design in which you collect quantitative data, such as survey ratings, and qualitative data, such as interviews or open-ended survey answers, during the same phase of a study. You analyze each dataset separately, then compare the results to see where they agree, where they differ, and what each one adds. Fetters, Curry and Creswell (2013) call this comparison step merging in their open-access paper Achieving Integration in Mixed Methods Designs.
What is the difference between convergent and sequential designs? A convergent design collects qualitative and quantitative data at the same time, while a sequential design runs them in order. In exploratory sequential design, interviews come first and shape a survey. In explanatory sequential design, a survey comes first and follow-up interviews explain its results. A convergent design runs the survey and interviews together and compares the findings once both analyses are finished.
Is convergent design the same as concurrent design or triangulation design? Yes. Convergent design, convergent parallel design, concurrent design, and triangulation design all name the same approach. Creswell and Plano Clark called it the triangulation design in 2007 and renamed it the convergent parallel design in 2011. Triangulation on its own is a broader idea, the practice of checking a finding against different methods, data sources, researchers, or theories.
What is an example of a convergent mixed methods design? Mazo Canola and colleagues (2026) used a convergent parallel design to study delays in triple-negative breast cancer care. The team interviewed 42 patients, analyzed insurance claims for 6,345 patients, and compared the results in a joint display. Longer treatment waits in the claims data matched patient accounts of dismissal and insurance obstacles, while emotional strain appeared only in the interviews. The interviews were coded in Delve using reflexive thematic analysis, and the full study is open access in Frontiers in Oncology.
What is a joint display in convergent design? A joint display is a table or figure that places related qualitative and quantitative findings side by side, usually one row per theme, with a column stating whether the results confirm, expand, or conflict with each other. Fetters, Curry and Creswell (2013) describe joint displays as one of three ways to integrate findings when interpreting and reporting a mixed methods study, alongside narrative and data transformation.
What should I do when my qualitative and quantitative findings disagree? Report the disagreement as a finding, then look for its source. Fetters, Curry and Creswell (2013) call this outcome discordance and suggest checking sampling and measurement for bias, reanalyzing the existing data, or collecting more. Rereading what one subgroup said often helps. In a qualitative tool like Delve, you can filter coded snippets to one group of participants and read their answers together.
What software do you need for a convergent parallel design? A convergent study usually needs two kinds of tools. A spreadsheet or a statistics package such as SPSS, R, or Stata handles the closed-ended survey data, and qualitative data analysis software handles the interviews and open-ended answers. Delve, a web-based qualitative coding tool, lets you import your full survey, code the open-ended responses alongside your interview transcripts, and use closed-ended questions such as demographics as filters. You can then export coded quotes and code counts to Word or CSV for your joint display.
Related resources
- Mixed methods research, an overview of combining qualitative and quantitative work
- Exploratory sequential design, a full walkthrough with a published example
- Explanatory sequential design, a full walkthrough with a published example
- Exploratory versus explanatory sequential design, how to choose between them
- Triangulation in qualitative research, the idea behind the original name of this design
- Qualitative survey analysis, on coding open-ended survey responses
- How to create a qualitative codebook, for building the shared codebook both data sources use
Citations
Creswell, J. W., & Plano Clark, V. L. (2007). Designing and conducting mixed methods research. Thousand Oaks, CA: SAGE Publications. https://searchworks.stanford.edu/view/6721278
Creswell, J. W., & Plano Clark, V. L. (2011). Designing and conducting mixed methods research (2nd ed.). Thousand Oaks, CA: SAGE Publications.
Fetters, M. D., Curry, L. A., & Creswell, J. W. (2013). Achieving integration in mixed methods designs: Principles and practices. Health Services Research, 48(6 Pt 2), 2134-2156. https://doi.org/10.1111/1475-6773.12117
Mazo Canola, M., Schear, R., Housman, L. T., Backus, K. V., & Hogea, C. (2026). Diagnostic delays, treatment timeliness, and patient experiences in triple-negative breast cancer: A mixed-methods study. Frontiers in Oncology, 16, 1826987. https://doi.org/10.3389/fonc.2026.1826987
Cite this article
Delve, Ho, L., & Limpaecher, A. (2026, October 6). Convergent parallel design: A practical guide. Delve. https://delvetool.com/blog/convergent-parallel-design-guide